Warehouse metrics
Revenue, MRR or support ticket counts usually live in tables your data team maintains in the warehouse, not in events. A warehouse metric is one number column of such a metric table, charted in a segmentation insight as a segment of its own, next to your event metrics.
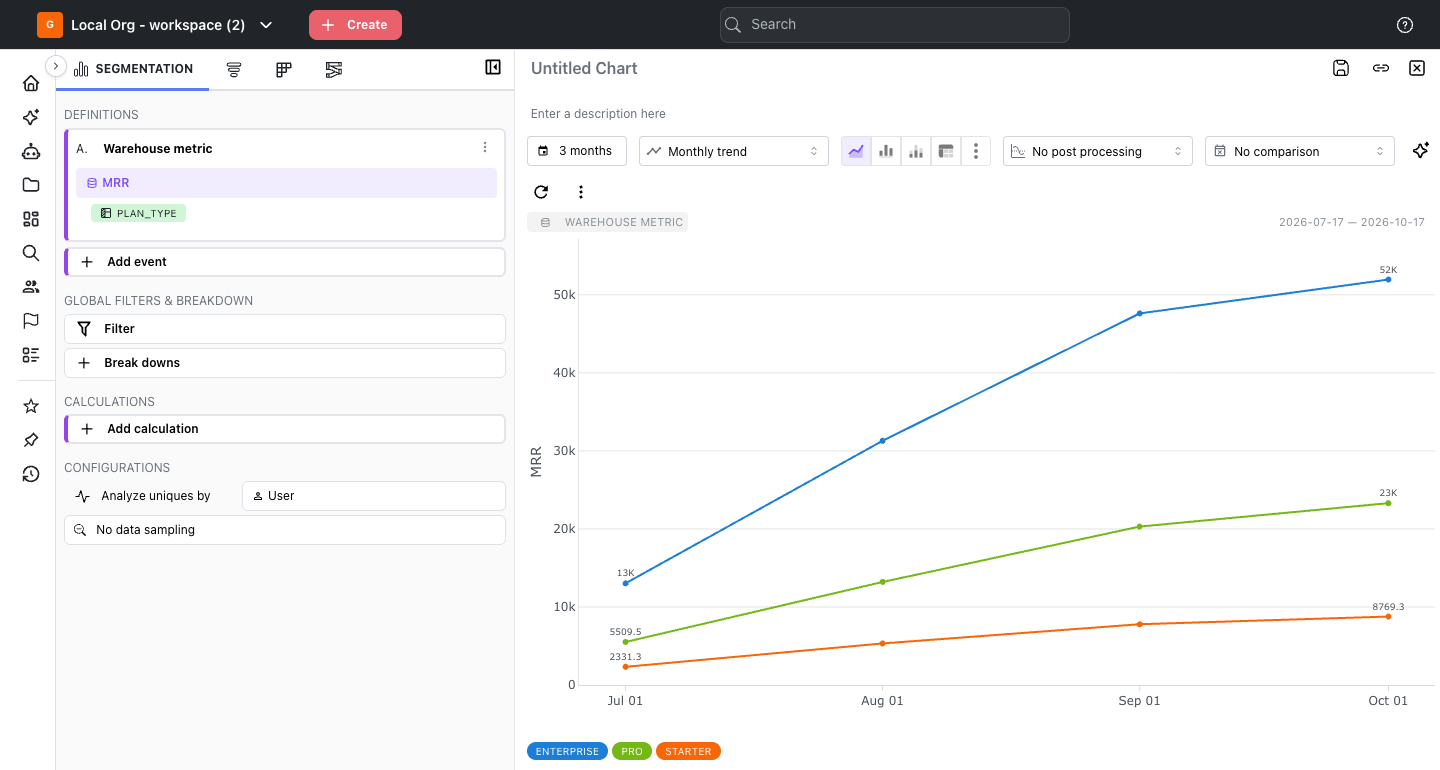
Use cases
- What was our MRR by plan at the end of each month?
- How much revenue did we book per active user each week?
- Did support ticket volume rise after the last release?
- Which industries bring the most revenue? (needs a company identifier on the metric table)
An admin adds metric tables in Data → Metric tables; their metrics are documented in the warehouse metric catalog.
Adding a warehouse metric to a segmentation
Warehouse metrics appear in the event picker under Warehouse metric, with their metric table and roll-up rule. The category shows once the workspace has at least one metric that isn't hidden. Only segmentation insights can chart a warehouse metric, and each one is a segment of its own: it can't be combined with events in the same segment. A funnel, retention or journey that uses one shows a message instead of a chart.
- In Segmentation, click Select an event and pick a metric from Warehouse metric.
- Pick the date range and time grain. Each period shows the metric rolled up with its rule, for example the last day's MRR for each month.
- Optionally break it down by one of its dimension columns with + Break downs.
The segment has no aggregation type; the number comes from the table. A Warehouse metric badge sits next to the date range; hover it to see the metric table and how longer periods roll up.
Time grains
A grain shorter than one row, weeks shown per month, quarter or year, and a Don't roll up metric at any other grain or as Overall show a message instead of a chart, with the reason under Show details. With Overall, the rule applies across the whole range: the total, the last row, the first row, the average day, the median or percentile day, the lowest or the highest day.
A table with one row per week, month, quarter or year always counts whole rows. When the date range starts or ends inside one of those periods, for example Last 30 days on a monthly table, the chart counts every period the range touches and says so with a badge such as Covers Sep 1 – Oct 31 (whole months). Pick a range that starts and ends on the table's period boundaries to count exactly that range. A daily table counts the exact range.
When the metric isn't broken down by every dimension column, rows are first added up across the other dimensions, then the rule applies. The same goes for an entity: broken down by a company's industry, each industry first adds up the rows of its companies. Average is unweighted: each day counts the same, however many orders or users it covers.
Use the latest value shows, for each period, the most recent day that has rows, adding up every row on that day; a plan with no row that day is left out. With a break down, every line uses that same day. Mitzu only uses rows inside the date range, or, on a table with weekly or longer rows, inside the whole periods the range touches. When the table has no rows in it, for example because today's row hasn't loaded yet, the chart says so and shows the dates the table does have rows for. To chart the latest complete day, exclude the current day in the date range picker.
Use the earliest value works the same way from the other end: each period shows its first day that has rows, adding up every row on that day.
Filters and break downs
Filter a warehouse metric with + Filter on its card, or with the insight's Filter. The value picker suggests the values indexing found. On the card, + Filter and + Break downs list every dimension column of the metric, labelled by its matching property: an event property, a property of an entity such as a user, or a warehouse column when it has none. When the metric table has an identifier, they also list the properties of every dimension table it joins. Only the dimension tables a chart uses are joined when it runs.
Entity properties describe each company as its dimension table holds it today, not as it was on the day of the row. Cohorts don't apply to warehouse metrics.
The insight's Filter and Break downs list a linked column once, as the property it is linked to; pick the property, and it applies to the metric through the column. An unlinked column is listed under its own name. When the insight also has event segments, the lists only offer what every segment can use, so a column only the warehouse metric has, or a property the metric has neither a column nor a joined property for, isn't offered. A filter or break down whose column link or identifier was removed later is left out of that metric, and a Filter not applied or Break down not applied badge says which.
Combining with event metrics
Use a warehouse metric in a formula like any segment, for example A / B with Revenue booked and unique users of Login. Both use the same date range and time grain, so their periods line up. On a table with weekly or longer rows, a metric needs a date range on that table's period boundaries in a formula, unless its rule is Use the latest value or Use the earliest value. Otherwise it would count whole months while the event metric counts only the range, and the formula shows a message instead of a chart.
Warehouse metrics on dashboards
A warehouse metric card on a dashboard follows the same rules as the insight it was saved from, with a few dashboard-specific notes.
Dashboard filters and break downs apply to a warehouse metric card the same way insight filters do: through a dimension column linked to the property, through a joined dimension table, or through a warehouse column picked by its own name. When a card can't use every dashboard filter, it shows its own results with an orange filter icon next to its date, as described in Filters, breakdowns, and overrides. Hover the icon to see which filter doesn't apply to which metric. Break downs work the same way.
Covers … (whole months) shows on a card whose table has weekly or longer rows when the dashboard's date range starts or ends inside one of those periods, for example Covers Sep 1 – Oct 31 (whole months).
No rows in this date range replaces the chart when the table has no rows in the card's date range, with the dates it does have rows for, for example finance.daily_revenue has no Revenue booked rows in this date range. It has rows from 2026-07-28 to 2026-10-28. When only some metrics on the card have no rows, the card shows a No … rows in range badge for each of them instead.
Refused cards show the reason in the card itself, for example "Warehouse metrics can only be charted in Segmentation" or "Revenue booked can't be shown per hour", with what to change underneath. People who can edit the insight also get a Fix saved insight button.
Trend type overrides that a metric table can't support are refused for that card only. Overriding a dashboard to Hourly trend, for example, refuses the cards whose tables have daily rows and refreshes every other card. Each refused card says why, such as "Each row of finance.daily_revenue covers one day."
Shared dashboard links show the same notes as the dashboard itself. PDF exports and scheduled reports print the notes as text under each card, along with the No rows in this date range message and the reason a card was refused.
Asking the analytics agent
The analytics agent sees the same warehouse metrics as the event picker, with their tables, roll-up rules, grains, dimension columns and joined dimension tables. Ask in business terms, for example "What was our MRR by plan in September?" or "Revenue booked per active user each week". The agent builds a segmentation insight on the metric, so its answer follows the same rules as a chart you build yourself and opens as a regular insight.
The agent breaks a warehouse metric down and filters it by the metric's own dimension columns and by the properties of the dimension tables its identifiers join, for example "MRR by industry". When you ask for a break down the metric has neither a column nor a joined property for, or a grain the table can't support, such as hourly MRR from a daily table, it says why and offers what the metric does support.
Removed metrics
A saved insight whose metric was removed shows "This warehouse metric no longer exists". Before you remove a metric table, the Remove dialog shows how many saved insights use its metrics.