Funnels in Mitzu
Mitzu's Funnels let you examine how end users perform a series of events. Funnels calculate and display the number of users who convert from one event to another within a particular time window.
Use Cases
Imagine your product is a B2B messaging application. You might use Funnels to answer these questions:
- What percentage of users converted through my signup funnel within 7 days?
- At what step of the signup funnel did most users drop off?
- How did my A/B test impact conversions in the signup funnel?
- How has the payment funnel conversion rate in the US changed over time?
- How long does it take most users to complete my payment funnel?
- What departments complete the payment funnel most often?
- What flows do users take between opening an app and making a purchase?
- What flows do users take that don't lead to a purchase?
- How do these two paths differ? Which actions should I nudge users toward or away from?
- What did the users who dropped off do instead?
Quick Start
Building a report in Funnels takes just a few clicks, and results arrive in seconds. Let's build a simple report together.
Let's measure the conversion rate of website visitors to your SaaS product. The typical question you would ask is, "How many users converted to start a trial?"
We should only consider conversions valid if the user started the trial within 7 days of their first visit.
We should also look at the last 4 months of data to get reasonable results.
Step 1. Switch to funnels
Click on the Funnels tab on the left side of the screen.
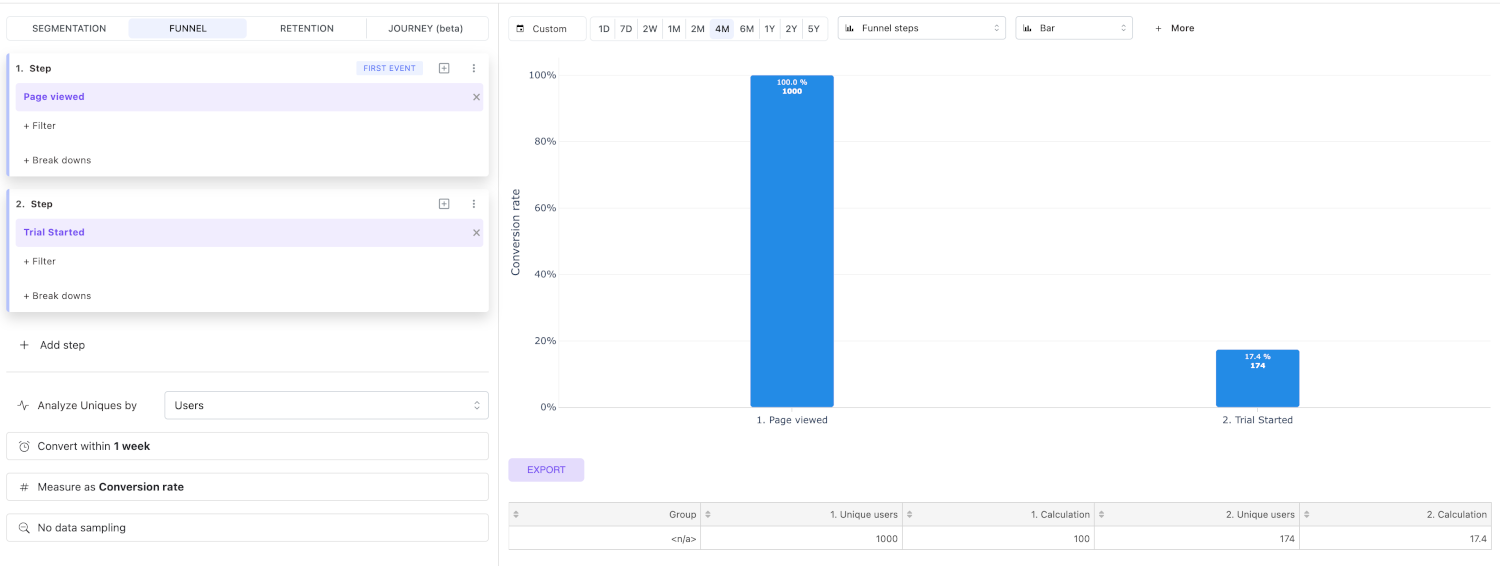
Step 2. Select the events
Select the steps of the funnel you want to analyze:
- The first step should be the website visit event.
- In our case, the second step should be the conversion event "trial started".
- For the
page viewedevent, select theFirst eventsegment filter. (This ensures we only consider the user's first visit.)
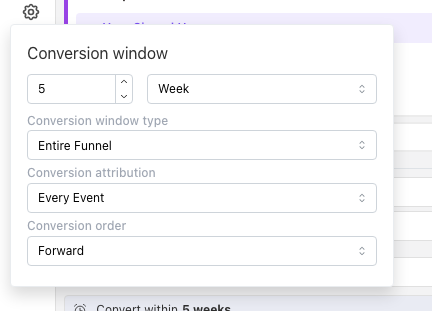
Step 3. Conversion window
Select the correct conversion window, 1 week, in the conversion window dropdown.
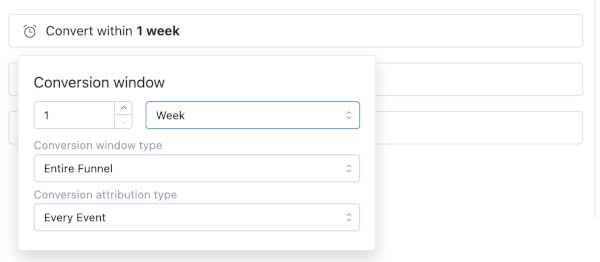
The rest of the settings are left at their defaults.
- Entire funnel conversion window type
- Every event conversion attribution
Step 4. Time window
Let's choose the 4M time window to achieve the desired results.
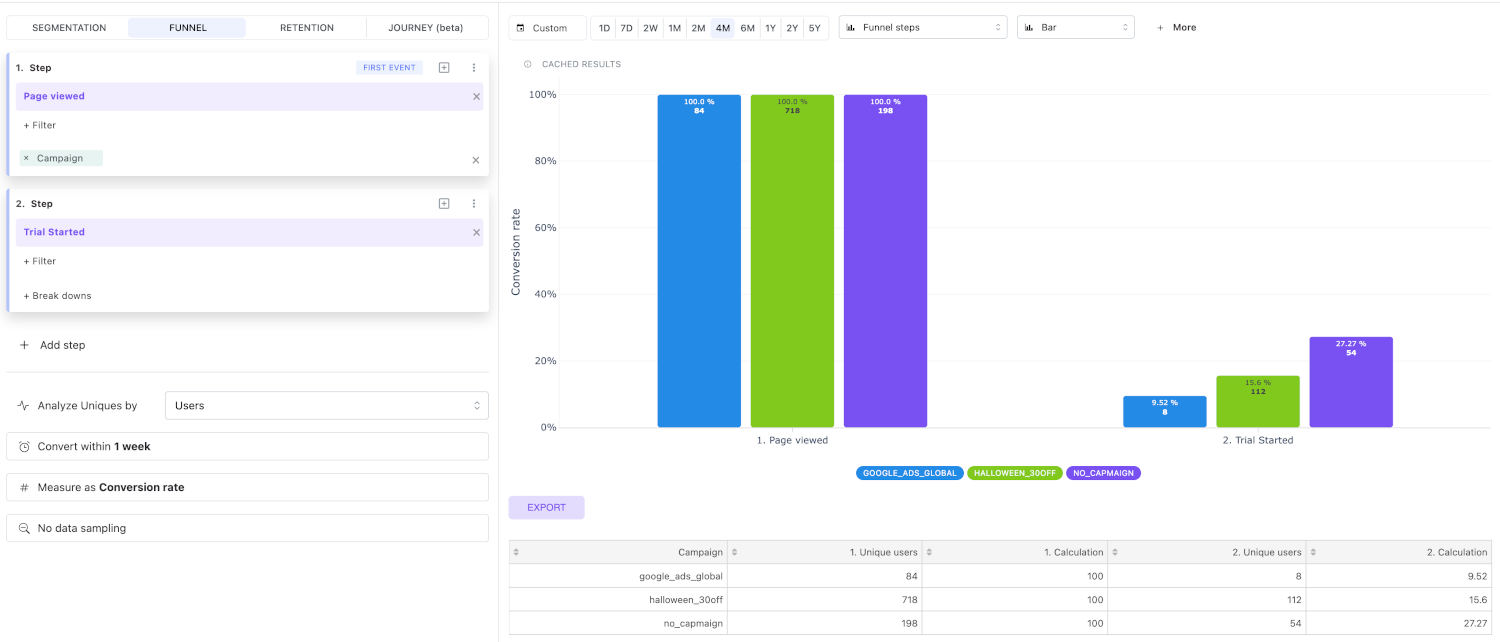
Switch to Funnel steps to see the overall conversion rate of the funnel.

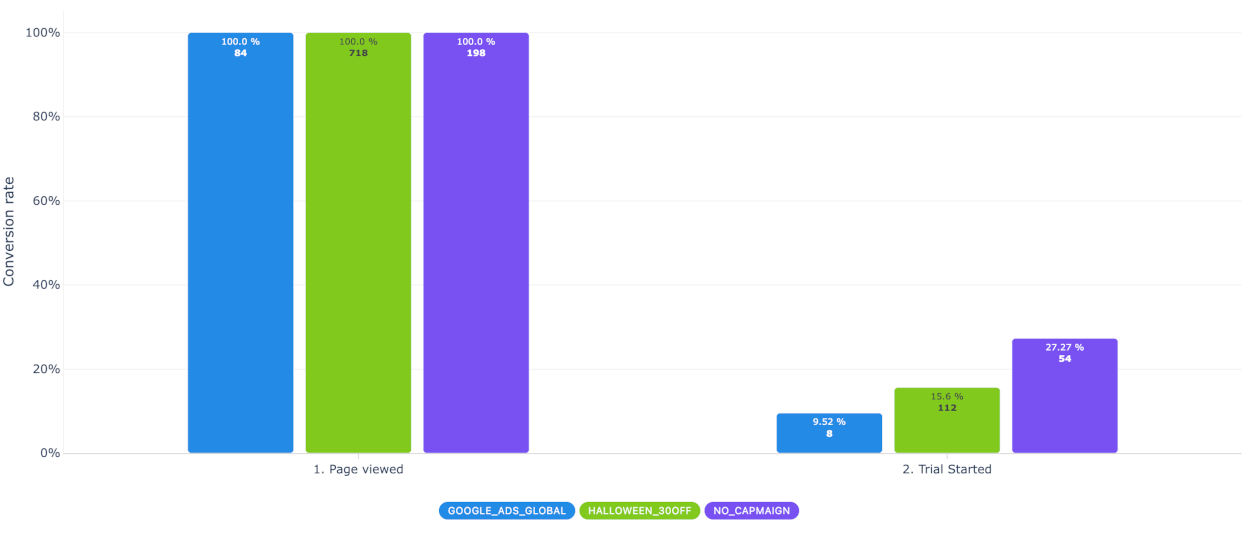
The results
After the 4th step, you should see the following results:
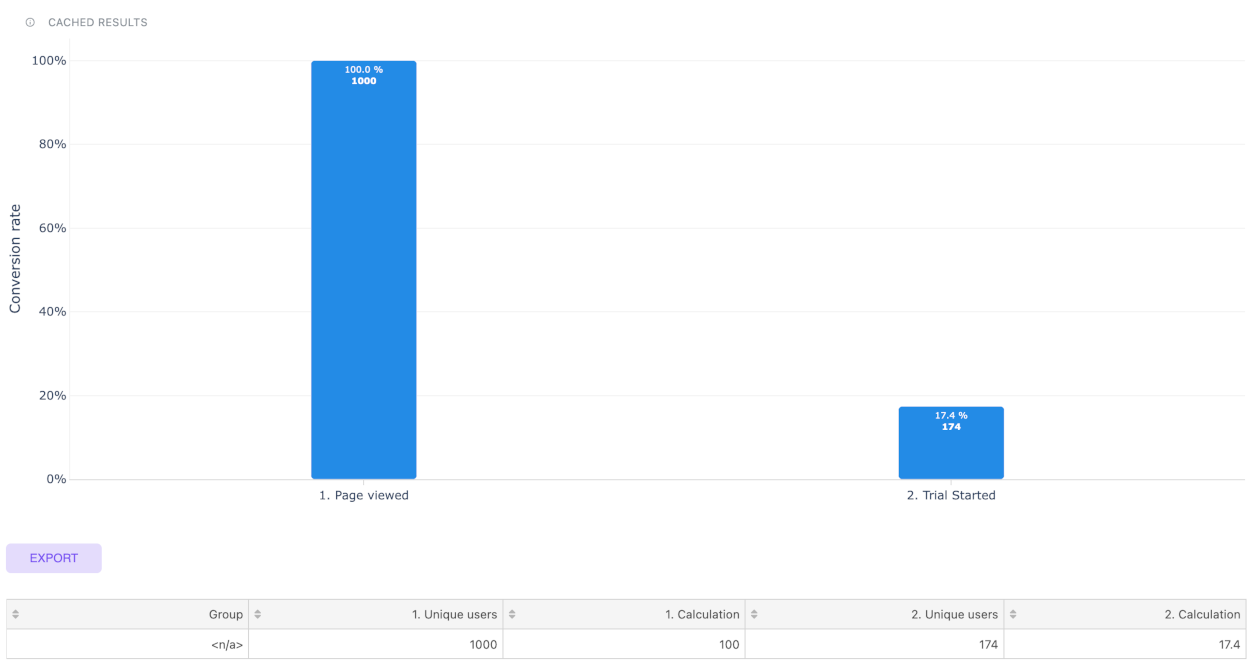
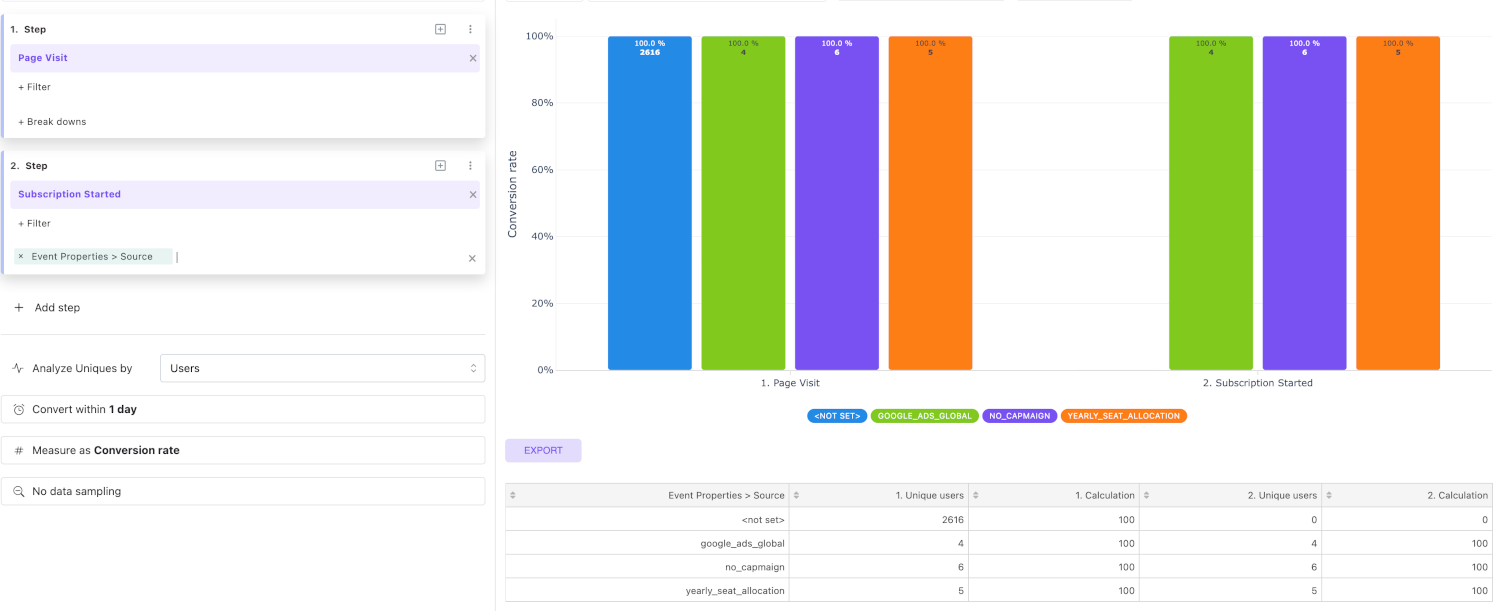
Extra step: breakdown
As an extra step, you can break down the funnel by the Campaign event property.
This visualizes how each campaign contributed to the conversion rate.
Conversion window
The conversion window is the time period during which the funnel steps must be completed.
The default value is 1 day, which means all steps must be completed within 24 hours.
Mitzu currently doesn't support funnels without a conversion window. If you need an unbounded funnel, increase the conversion window to 10 years.
The conversion window can significantly affect the funnel's performance. With longer conversion windows, the SQL engine has to join more events, resulting in longer query execution times.
Conversion window type
This setting allows you to choose the type of conversion window. Currently, we support two types of conversion windows:
- Entire funnel - all the steps must be completed within the conversion window.
- Between each step - the maximum amount of time that can pass between any two consecutive steps must be within the conversion window.
Conversion attribution
This setting allows you to choose the attribution of the conversion. It has no visible effect on the "Conversion rate" aggregation type (which is the default aggregation type), but it does affect the "Custom aggregations" and "Time to convert" aggregation types.
Currently, we support two types of conversion attribution:
- Every event - each event is considered a "converting" event of the funnel.
- First event - only the first event of each step (segment) is considered a converting event.
Conversion order
The Conversion order setting lets you choose the temporal direction of the funnel:
- Forward (default) - users must perform the steps in the order you defined them, with each step happening after the previous one. This is what you usually want.
- Reverse - users must perform the steps in the opposite order. This is useful for retrospective analysis: "of the users who reached the checkout step, how many had previously visited the landing page within the conversion window?"
Reverse funnels still use the same conversion window — only the direction of step ordering is flipped.
Loose timestamp comparison
Some funnels combine events from different sources — for example backend and frontend events — whose clocks are not always perfectly aligned for the same user interaction. When that happens, two steps that logically occurred in order can appear a few seconds out of order, and the user is counted as not converted.
Enable Loose timestamp comparison (the checkbox at the bottom of the conversion window menu) to allow a 1 minute grace period when comparing the order of events. With it on, a step can happen up to 1 minute before the previous step and the user is still counted as converted.
The grace period only relaxes the ordering of the steps — the conversion window itself still applies. The default value comes from your project's insights settings and can be overridden per funnel.
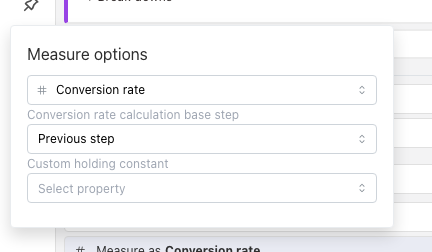
Conversion rate base step
When the measurement type is Conversion rate, you can configure how the per-step conversion rate is computed:
- Previous step (default) - each step's conversion rate is
(users at this step) / (users at the previous step). This makes step-by-step drop-offs easy to spot. - Base step - each step's conversion rate is
(users at this step) / (users at the first step). This gives an end-to-end conversion at every step.
The setting has no effect on overall conversion rate (between the first and last steps) — only on the intermediate steps in Funnel steps.
Practical examples
Let's consider the following funnel:
- Landing page visit
- Payment for an item on an e-commerce website
To measure the total revenue, you can use the "Every event" conversion attribution with the "Sum of revenue" aggregation type.
However, if you want to measure the average time it takes to reach the first payment, you can use the "First event" conversion attribution with the "Average time to convert" aggregation type.
Performance implications of conversion attribution
Mitzu's SQL engine uses LEFT OUTER JOIN with the "every event" conversion attribution,
and a WINDOW FUNCTION with the "first event" conversion attribution.
Window functions are an order of magnitude faster than left outer joins. We recommend defaulting to "first event" conversion attribution if you have a large dataset. You can change the default conversion attribution in the "Conversion attribution" setting on the Insight settings page.
Measurement types
Mitzu funnels have rich support for measurement (or aggregation) types.
By default, Mitzu uses the "Conversion rate" measurement type.
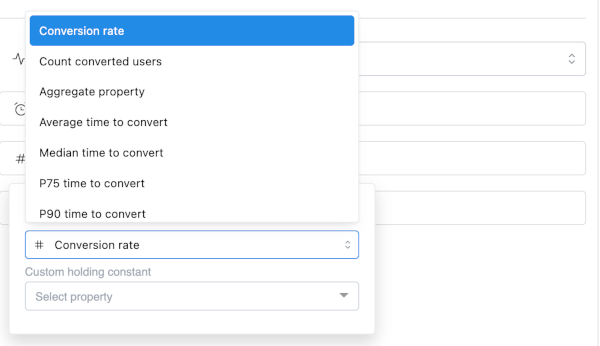
The supported measurement types are:
- Conversion rate - the number of converted users divided by the number of users who started the funnel.
- Count converted users - the number of users who completed the funnel steps.
- Count converted events - the number of converting events on the last step. Use this when a single user can convert multiple times (e.g., a user who completes several purchases) and you want to count the events rather than the unique users.
- Average time to convert - the average time it takes for users to convert.
- Median time to convert - the median time it takes for users to convert.
- PXX time to convert - the XXth percentile of time it takes for users to convert.
- Min time to convert - the minimum time it takes for users to convert.
- Max time to convert - the maximum time it takes for users to convert.
- Aggregate property - a custom aggregation of any property value from the funnel's last segment (step).
Trends vs. Overall measurement configuration
If you are visualizing a funnel trend, the measurements are calculated between the first and last steps only. However, users must still complete each step in the funnel in order to be considered "converted".
If you want to visualize the funnel as an overall measurement, the measurement is calculated for all the steps in the funnel. The exception is the "Aggregate property" measurement type, which aggregates the values of the last step only in both cases.
Custom holding constant
As previously mentioned, a user is considered "converted" if the same user completes all the steps in the funnel. With custom holding constants, you can modify this behavior.
For example, suppose you want to consider a conversion successful only if it happened within the same browser session.
For this purpose, we have introduced the Custom holding constant setting. You can pick any property present in all the steps of the funnel.
In the example above, you would set the Custom holding constant to session_id.
This ensures that Mitzu measures the conversion rate of users who converted within the same browser session.
A custom holding constant never replaces the analyzed entity — the entity you selected in Analyze by (the user by default) is always kept. The holding constant is an additional requirement layered on top of it, so a conversion only counts when the same entity completes the steps and the steps share the same holding-constant value. A later step performed by a different user, or by the same user in a different session, is not counted.
Difference between "Custom holding constant" and "Analyze by"
If you change the Custom holding constant setting, the measurements still calculate user conversion rates (or any other user-level measurement).
However, if you change the Analyze by setting, the target entity for the measurements changes. For example, if you set Analyze by to Groups, the measurements are calculated for unique groups.
You can also set Analyze by to session_id. In this case, you will measure the number of successfully converting sessions.
This documentation uses session_id as an example. However, your data in the data warehouse might not have a session_id column.
Funnel step breakdown
You can set a breakdown on any of the funnel steps, as long as the breakdown is set on a single step. The most common way to break down the funnel is by one or more properties of the first step.
If you break down the funnel by a property from the second step or later, you will often see the breakdown value <not set>.
This represents the segment of users who didn't convert between the previous step and the step containing the breakdown.
Trends vs. Overall measurement configuration
We already discussed trends vs. overall measurement configuration in the Insight basics section.
In this section, we consider this setting in the context of funnels.
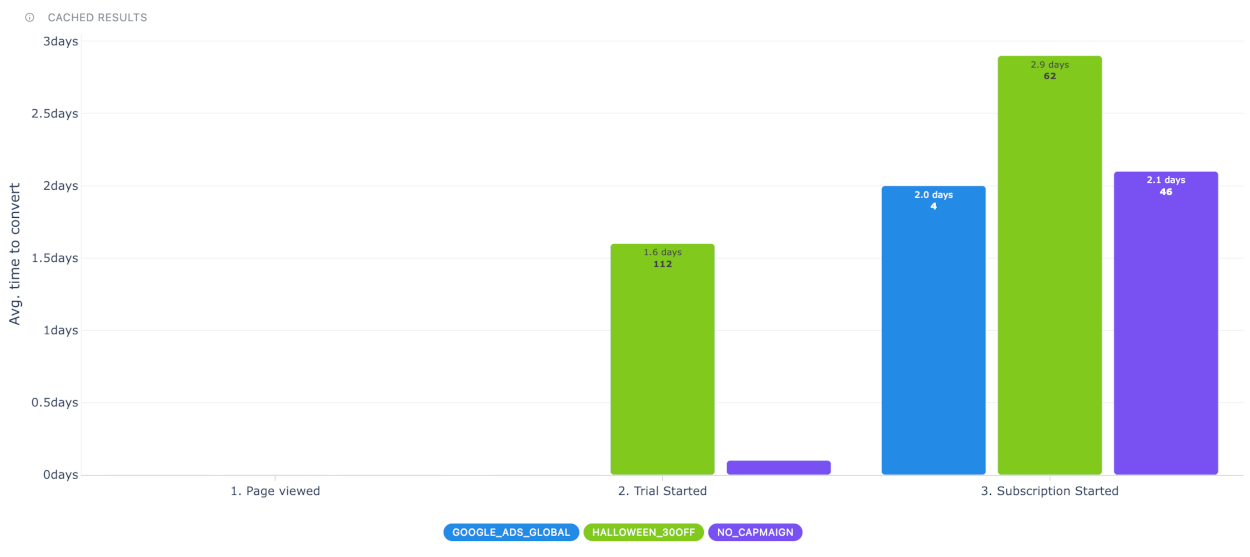
Funnel steps
The overall measurement type is called Funnel steps, and the visualization is a bar chart (or GEO chart).
In a bar chart, each group represents the associated measurements for each step of the funnel.
By default, each group in the bar chart shows the funnel's conversion rate (or other measurement) up to that step.
Below, you can see the funnel steps for the time-to-convert measurement.
Funnel trends
The main thing to consider when visualizing funnel trends is that we attribute each conversion to the date of the first step of the funnel.
Consider the following funnel:
- Page viewed
- (Checkout) Payment for an item on the e-commerce site
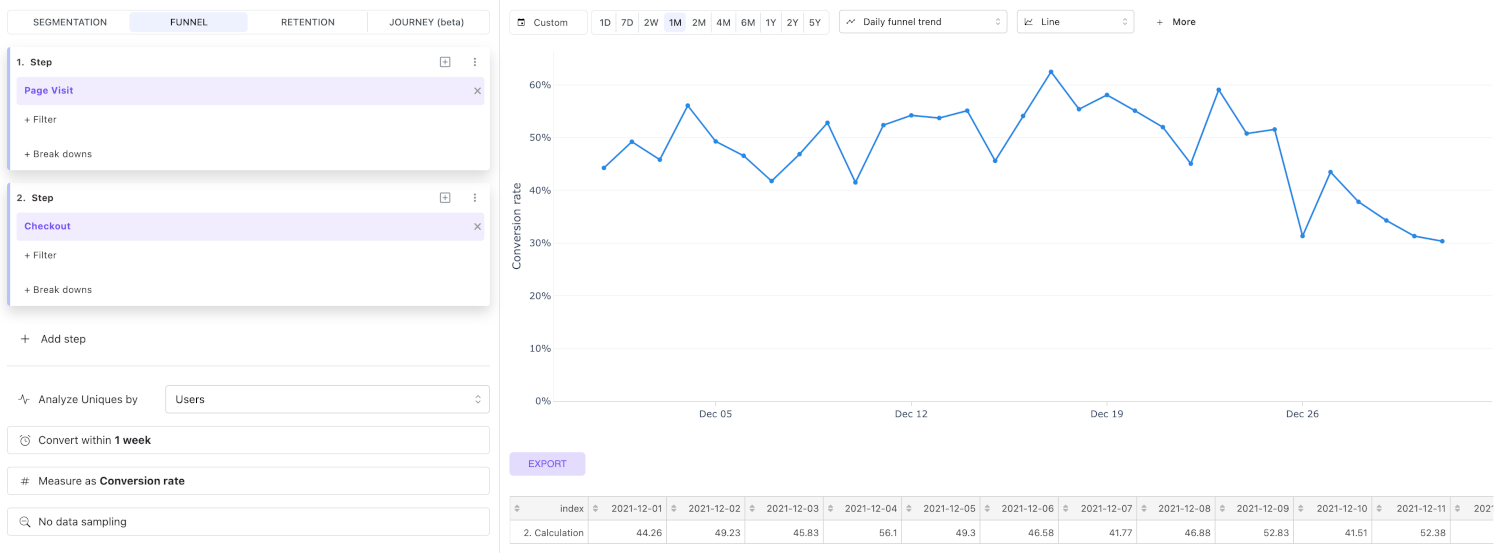
In this case, the conversion window is set to 7 days. The checkout may have happened 6 days after the page view, but we still attribute the conversion to the date of the page view event.
This is true for any number of funnel steps.
Funnels support hourly, daily, weekly, monthly, and yearly trends. Quarterly is not available for funnel trends.
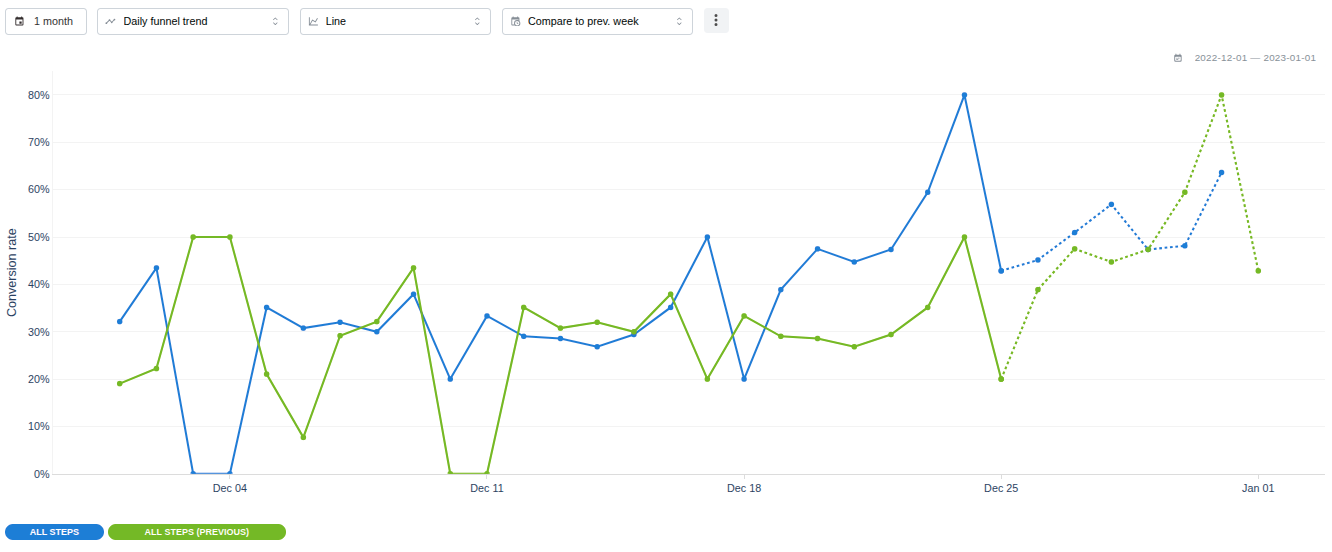
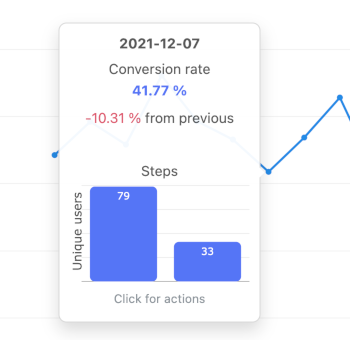
Dotted lines in funnel charts
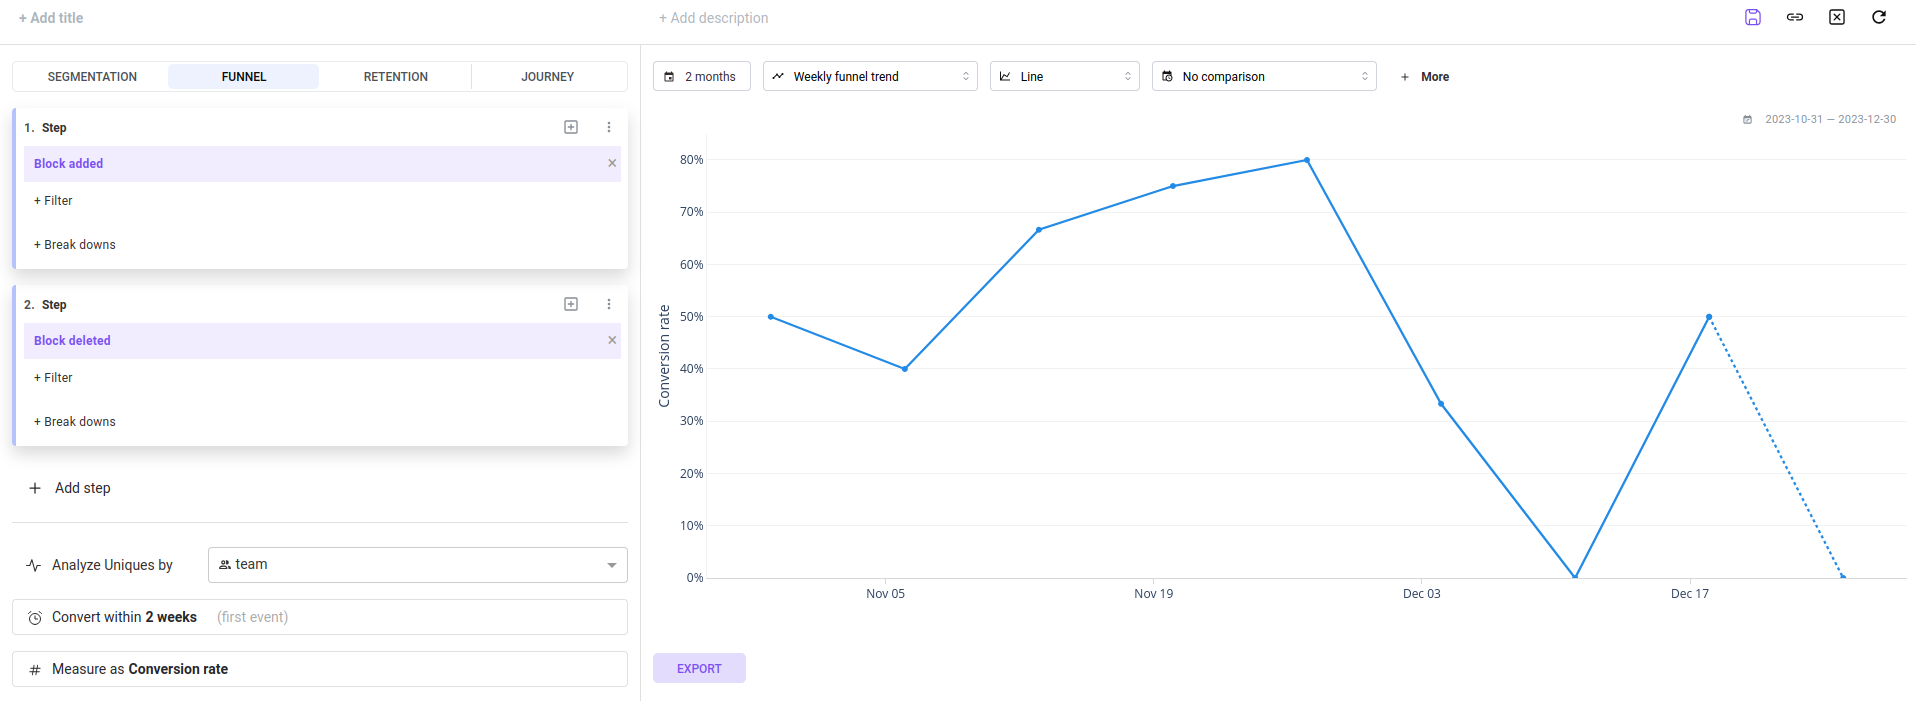
Dotted lines in funnel charts indicate that users entering the funnel at a given point have not yet had sufficient time to complete the funnel within the defined conversion window. The section with the dotted line is considered incomplete, meaning conversions beyond this point may still occur but are not yet recorded.
This helps distinguish between actual drop-offs and conversions that could still be in progress.
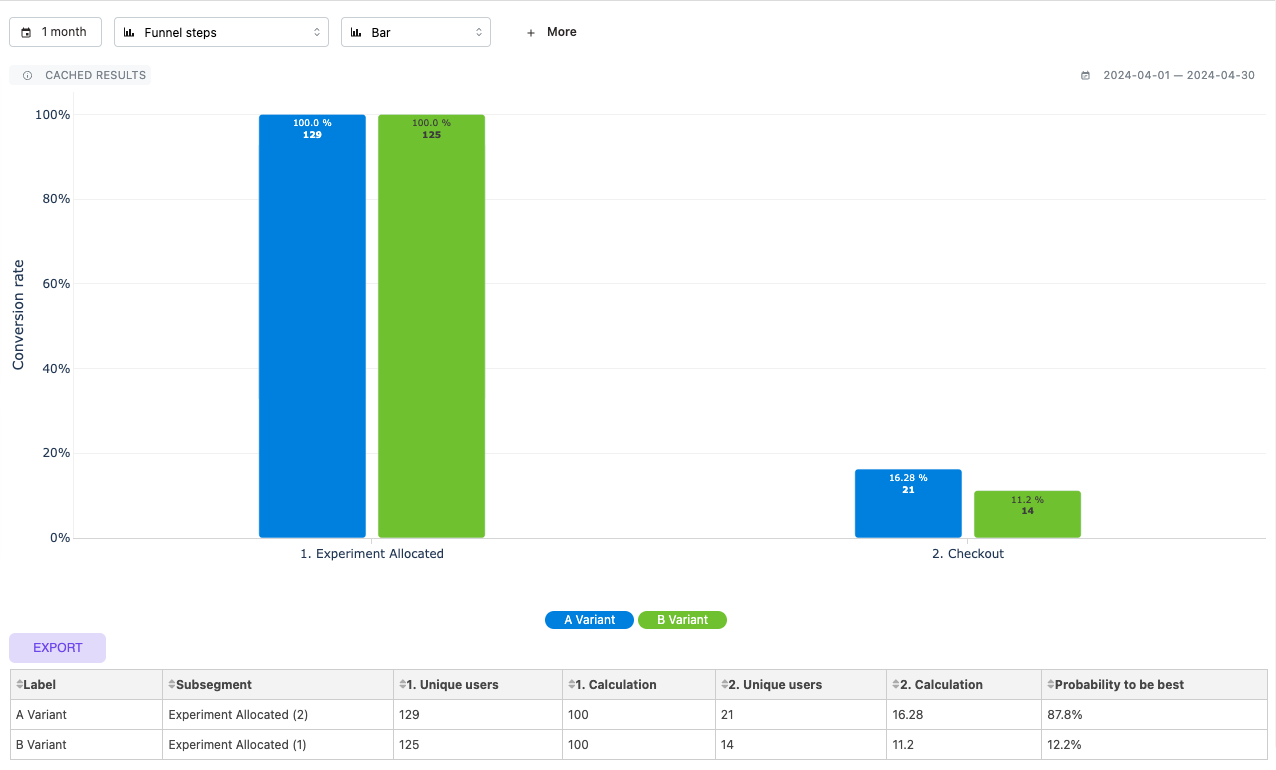
Probability to be best (Bayesian)
With funnel insights, you can also see the probability that a variant has the highest true conversion rate, based on Bayesian sampling from posterior distributions. This feature is only available for funnel insights with overall measurements (Funnel steps).
This feature is most useful for A/B test analysis.
Bayesian A/B testing calculates the probability of a variant being the best by combining prior beliefs with observed data. Given two variants (A and B), we model their conversion rates as Beta distributions (posterior beliefs) using Bayesian inference. The probability that one variant is better than the other is computed by simulating many samples from these posteriors and checking how often one exceeds the other. This Monte Carlo method estimates P(A > B) or P(B > A) directly, giving actionable probabilities instead of p-values. Unlike frequentist tests, Bayesian A/B testing continuously updates beliefs and allows stopping based on confidence thresholds.
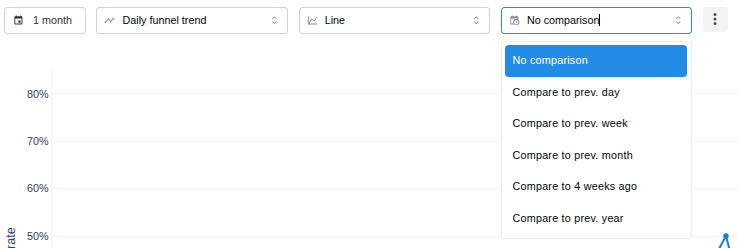
Comparison
The Comparison feature lets you analyze and evaluate data trends by comparing them against a previous time window. For example, you can compare data points from the last month with those from the preceding month.
To enable comparison, select the desired comparison window from the dropdown menu.
In funnels, comparisons are currently supported using absolute values. Additional comparison methods will be introduced in future updates. For details on the product roadmap, please contact us at support@mitzu.io.
Comparison with absolute values
When using comparison with absolute values, the chart displays:
- the data points from the selected insight time window, and
- the data points offset by the chosen comparison time period.
Both sets of data are visualized together, making it easy to identify trends, similarities, and deviations between the two time windows.