Journeys in Mitzu
Mitzu's journey charts give you a visual map of every path users take through your product. Journeys calculate the user count and conversion rate for each step along every path.
Use Cases
Imagine your product is a B2C webshop, and you bring visitors to your webshop through different blog posts and marketing campaigns. You might use journeys to answer questions like:
- Which marketing campaign generates the most revenue?
- In a checkout flow, which steps do users drop off at most?
- How are users segmented in the middle of a funnel?
Quick Start
Building a report in journeys takes just a few clicks, and results arrive in seconds. Let's build a simple report together.
Imagine we have a webshop where visitors to our landing page can subscribe to emails. Later, we email them with our latest prices.
Let's say we ran a campaign called 20% off from all prices, and we want to see in which countries these emails led to a checkout and in which countries they didn't perform.
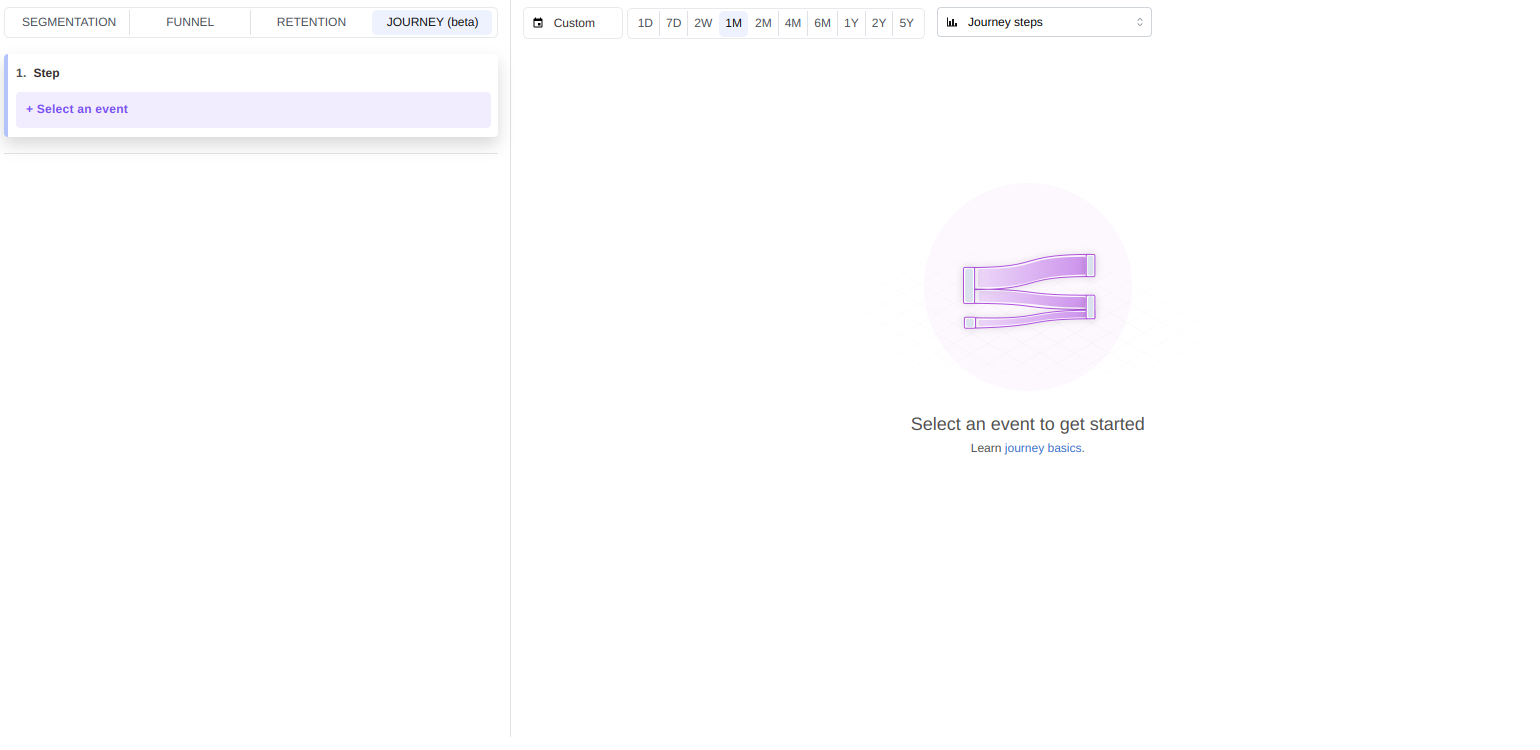
Step 1. Switch to journeys
Click on the Journey tab on the left side of the screen.
Step 2. Select the events
Select the steps of the journey you want to analyze:
- The first step should be the
Page visitevent with a filter on theAcquisition campaignproperty set to the valuepromo_20off. - Click
+ Add eventand add the following events:Email sent,Email opened, andCheckout. - For the
Email openedevent, selectUser Country Codeas the breakdown.
Step 3. Conversion window
Select the correct conversion window, 2 weeks, in the conversion window dropdown.
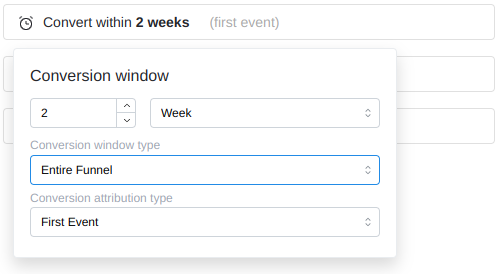
You can leave the rest of the settings at their defaults.
- Entire funnel conversion window type
- First event conversion attribution
Step 4. Time window
Let's choose the 1M time window to achieve the desired results. The <drop off> nodes represent users who started the flow but did not finish it.

The results
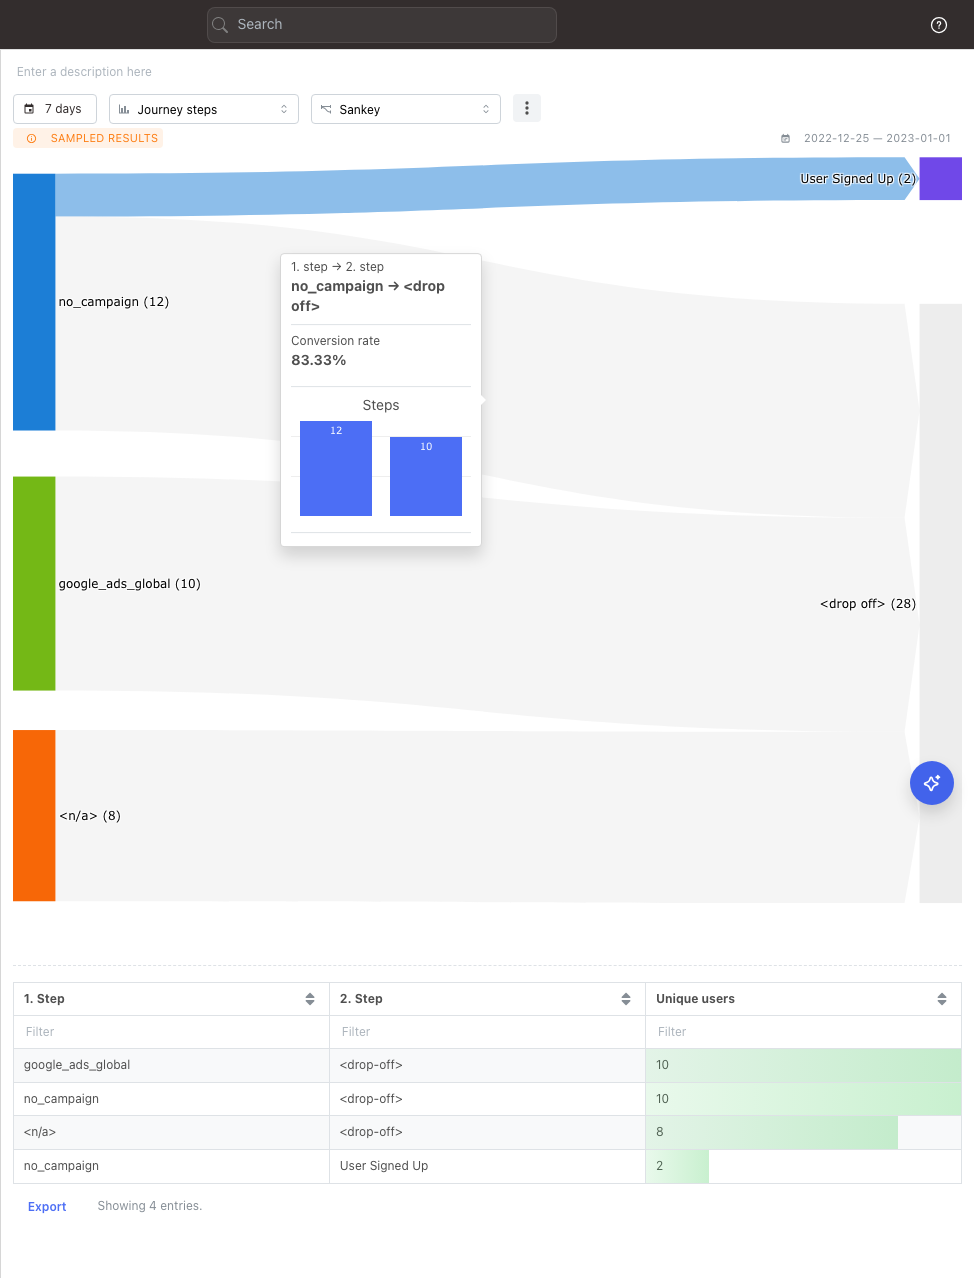
After the 4th step, you should see the following results:
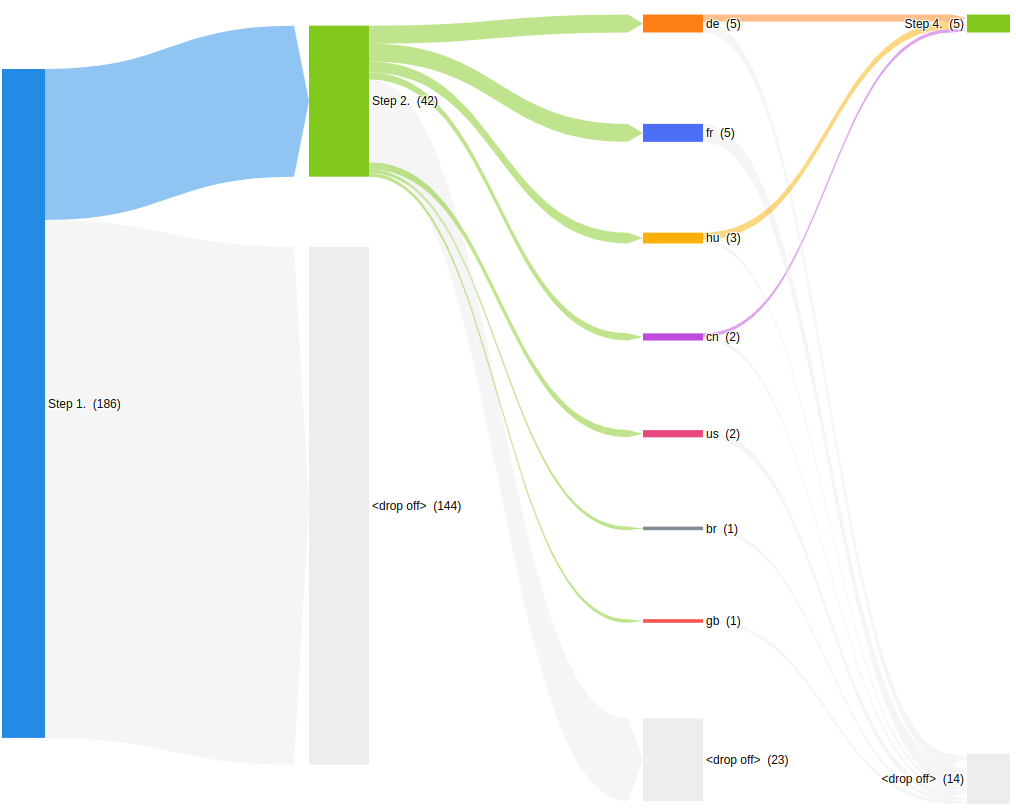
On the chart, we can see all user paths through the selected events. By hovering the cursor over nodes and links, we can gather further details about each specific path.
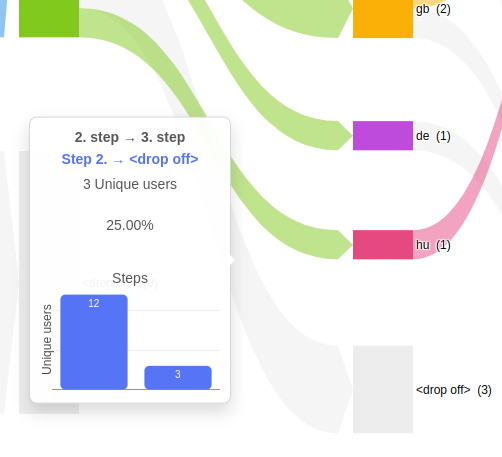
For example, only 25% of users did not open the emails within two weeks. In this case, the email tracking service may show a 75% open rate, but from the next step of the journey chart, we can see that the majority of these users dropped off before the checkout event.
Another example is that users from the US, China, and Germany don't check out after these emails, so they may need to be targeted differently.
Conversion window
The conversion window is the time period during which the journey steps must be completed.
The default value is 1 day, which means all steps must be completed within 24 hours.
Mitzu currently only supports journeys with a conversion window. If you need an unbounded journey, increase the conversion window to 10 years.
The conversion window can significantly affect the journey's performance. With higher conversion windows, the SQL engine will join more events, resulting in a longer query execution time.
Conversion window type
This setting allows you to choose the type of conversion window. Currently, we support only one type of conversion window for journeys:
- Entire funnel - all the steps must be completed within the conversion window.
Conversion attribution
This setting allows you to choose the attribution of the conversion. Currently, we support only one type of conversion attribution for journeys:
- First event - only the first event of each step (segment) is considered a converting event.
Loose timestamp comparison
Journeys often combine events from different sources — for example backend and frontend events — whose clocks are not always perfectly aligned for the same user interaction. When that happens, two steps that logically occurred in order can appear a few seconds out of order, and the user is counted as not converted.
Enable Loose timestamp comparison (the checkbox at the bottom of the conversion window menu) to allow a 1 minute grace period when comparing the order of events. With it on, a step can happen up to 1 minute before the previous step and the user is still counted as converted.
The grace period only relaxes the ordering of the steps — the conversion window itself still applies. The default value comes from your project's insights settings and can be overridden per journey.
Measurement types
Mitzu supports only one measurement (or aggregation) type for journeys:
- Conversion rate - the number of converted users divided by the number of users who started the funnel.
Chart type
Journey insights are always visualized as a Sankey diagram. Other chart types (bar, line, GEO, etc.) are not available for this insight type.
- Each node represents a step (event) of the journey or the
<drop off>exit point. - Each link between two nodes represents the share of users moving from one step to the next.
- The width of a link is proportional to the number of users following that path. Hovering a node or link shows the user count, conversion rate from the previous step, and any breakdown values you've configured.
Drop-off nodes
Whenever users start the journey but fail to complete the next step within the conversion window, they end up in a <drop off> node attached to the step they didn't pass. Drop-off nodes make it visually obvious where users leave the flow — the bigger the drop-off node, the more users you're losing at that step.
A user only contributes to a drop-off node from the last step they reached. If a user completes step 1 but never reaches step 2, they show up in the drop-off attached to step 2 — not in any earlier or later one.
Step breakdowns
You can break down any step of the journey by an event property (just like funnels). The breakdown values become separate nodes in the Sankey diagram, letting you see how each variant flows through the rest of the journey.
In the quick-start above, breaking the Email opened step down by User Country Code is what produces the per-country flows in the screenshot.
Custom holding constant
As previously mentioned, a user is considered "converted" if the same user completes all the steps in the journey. With custom holding constants, you can modify this behavior.
For example, suppose you want to consider a conversion successful only if it happened within the same browser session.
For this purpose, we have introduced the Custom holding constant setting. You can pick any property present in all the steps of the journey.
In the example above, you would set the Custom holding constant to session_id.
This ensures that Mitzu measures the conversion rate of users who converted within the same browser session.
A custom holding constant never replaces the analyzed entity — the entity you selected in Analyze by (the user by default) is always kept. The holding constant is an additional requirement layered on top of it, so a conversion only counts when the same entity completes the steps and the steps share the same holding-constant value.