Retention
Use Cases
Maximizing user retention is a critical part of your business's success. Mitzu's retention feature lets you analyze how users or groups are retained by your product or marketing site.
Quick Start
In this example, we will showcase how users are retained in our application. We consider users "retained" if they have paid their monthly renewal fee.
The goal of the analysis is to visualize our users' overall monthly retention rate for the last year. On top of that, we want to see how the retention rate changes over time with monthly granularity (cohort retention).
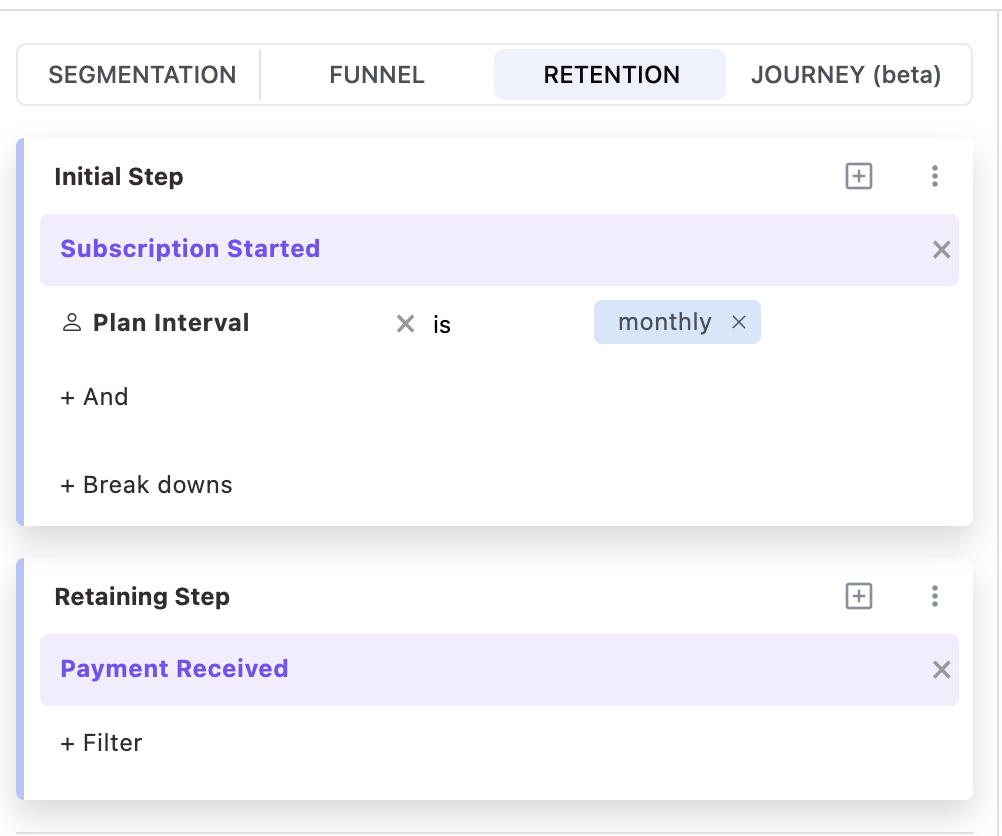
Step 1. Switch to retention and select events
First, switch to the retention insight tab and select the events you want to analyze.
As the Initial event, I will select Subscription started, since we are only interested in users who
started a subscription.
Remember that you can set a segment filter on this event. For example, first event narrows the scope of the analysis to the user's first subscription.
We will now apply a property filter on Plan interval. We will select only users who performed Subscription started events with a monthly plan interval.
For the second event, we can pick Payment received.
Step 2. Select the retention window
For this example, I will set the retention period to All groups.
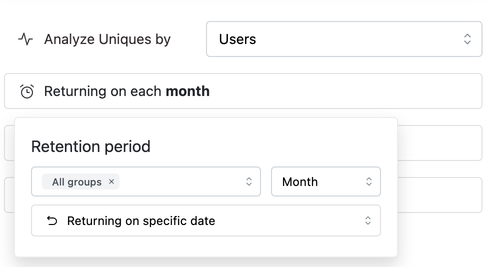
The retention period is the period you want to analyze retention for.
All groups means we will analyze the month over month retention of our user base for the last year.
Alternatively, I could pick Month 1 retention, which would show the retention rate of users after their first month.
Step 3. Select trends vs. overall measurement configuration
Let's select the 1Y time window for our retention analysis.
By default, Mitzu shows the change in retention rate over time. However, you can also visualize the retention rate as a whole (overall retention rate).
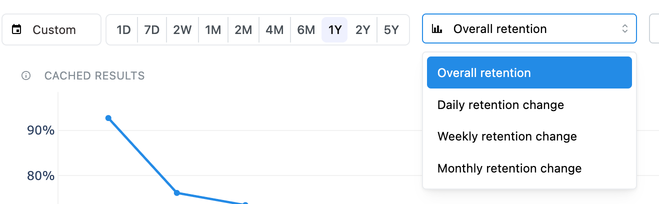
The results
By selecting the Overall retention configuration with All groups as the retention period configuration, we will see the typical retention curve on our graph.
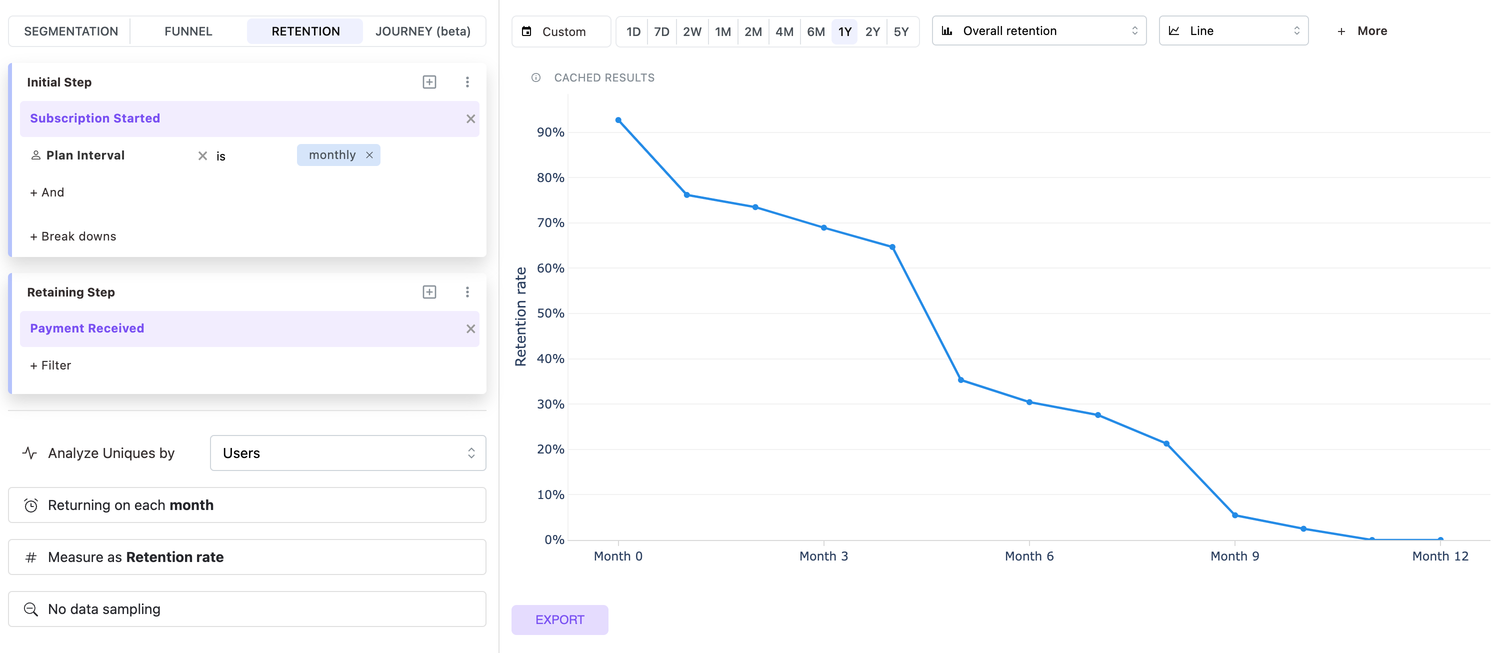
This shows the month-over-month retention rate for our users, regardless of which month they started their subscription, as long as the subscription was started within the last year.
Cohort retention / retention trend over time
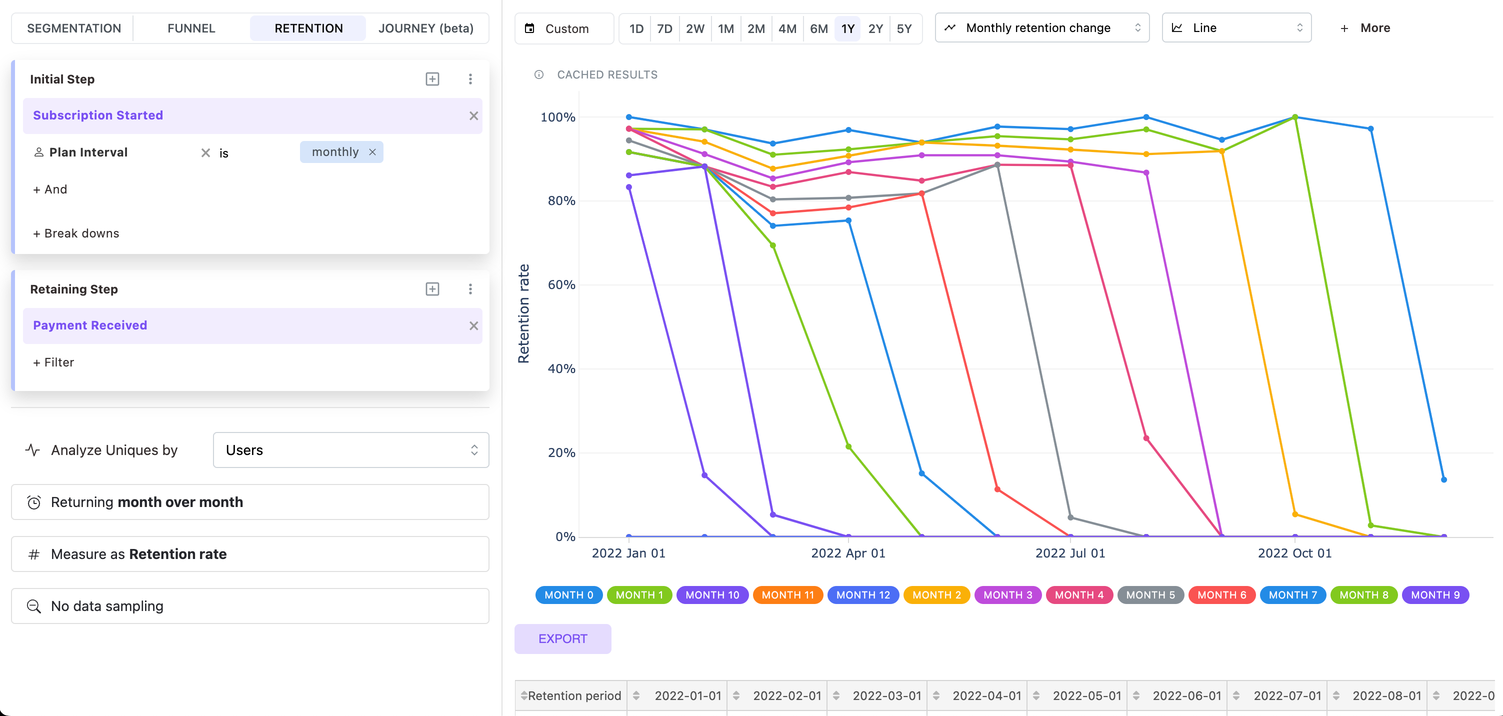
You can select the Monthly trend configuration for the trends vs. overall measurement configuration.
This shows you the change in retention rate over time for each of the last 12 months.
This chart can become very noisy if you have a long time window.
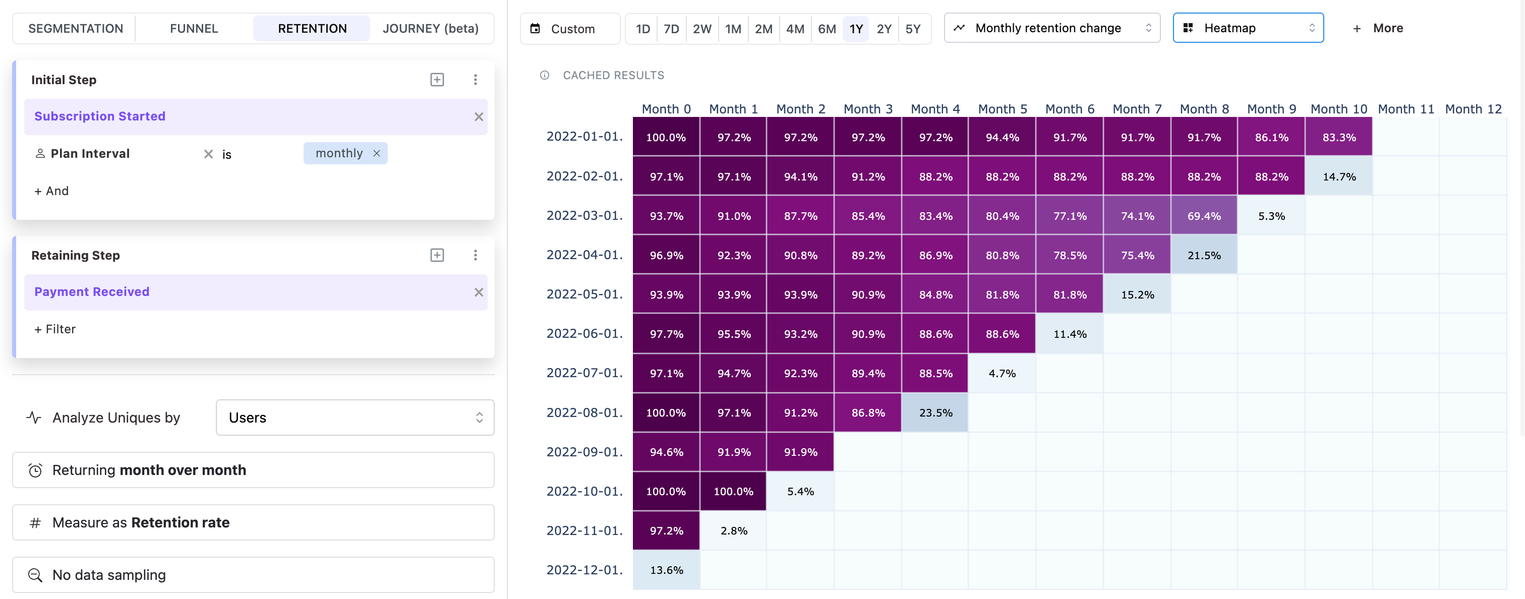
It is often better to visualize this as a heatmap.
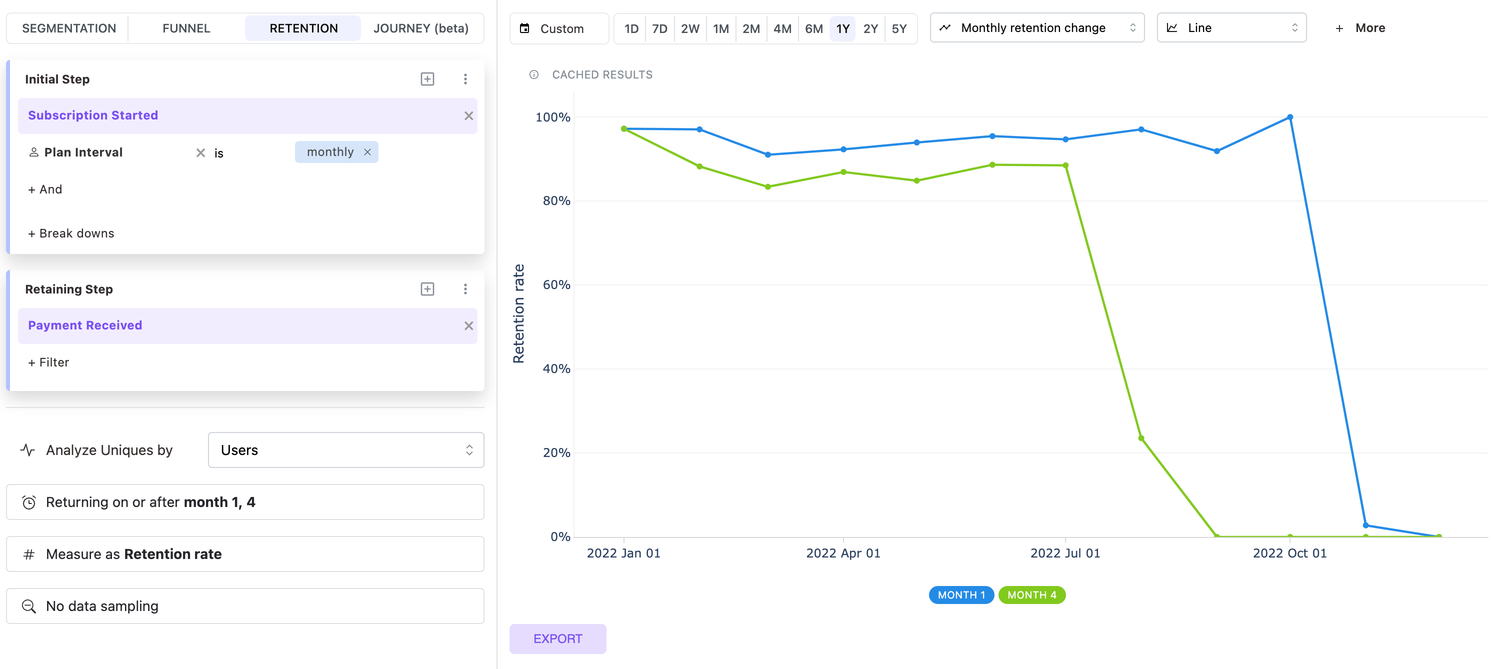
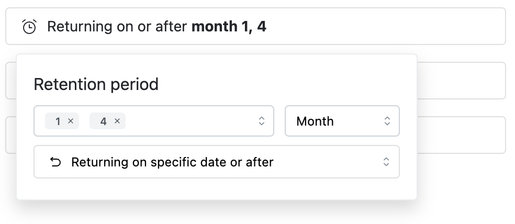
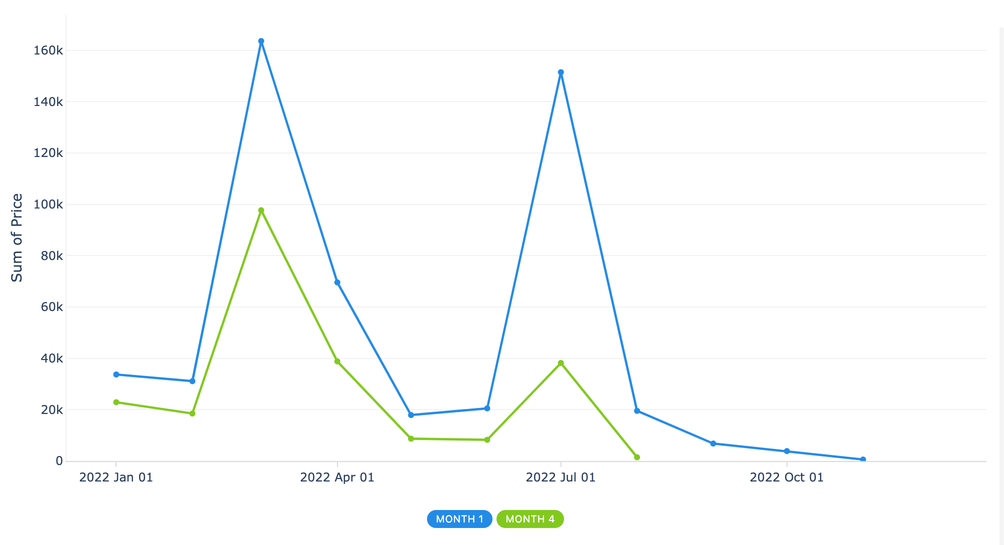
However, if this is still too noisy, you can remove the All groups retention period config, select only months one and four, and visualize the result as a line chart.
Retention features
Retention period
The retention period is the configuration that lets you compare retention rates across different periods.
In this dropdown component, you can select multiple values simultaneously.
For example, by selecting Month 1 and Month 2, you will see the retention rate for the first and second months after the initial step.
The retention period <1 means Month 0, which measures the retention rate of users in the same Month as the initial step.
Mitzu calculates retention in relative periods. For example, if the retention period is set to 4 weeks, users are considered retained if they perform the retaining event between 21 and 28 days after the initial step.
In other words, the retention period doesn't refer to calendar months or weeks.
Retention window granularity
The retention window selector lets you choose the granularity of the retention buckets:
Day- day-over-day retention.Week- week-over-week retention.Month- month-over-month retention (used in this guide's examples).Year- year-over-year retention.
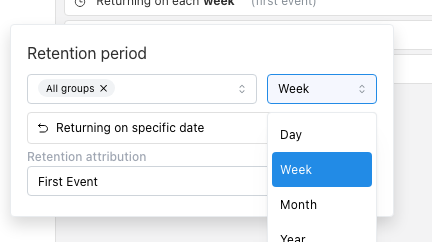
Pick the smallest granularity that still produces meaningful cohort sizes — daily retention works for high-frequency products like messaging apps, while monthly or yearly is more appropriate for subscription products.
Custom holding constant
Similar to Funnels, you can set a custom holding constant for the retention analysis.
To continue our example, we will set the Custom holding constant to subscription_id.
This measures the retention rate of users who performed the payment_received event with the same subscription_id as the one their subscription was started with. This is crucial for correctly attributing the retaining events.
The retaining entity is unchanged — retention is still measured for the entity set in Analyze uniques by (the user by default). The holding constant only adds a requirement that the retaining event shares the same value (here, the same subscription_id) as the initial event; it never lets a different user's event count as a retention.
As with funnels, the Analyze uniques by config changes the target entity for the retention analysis.
You can switch to Groups to measure the retention rate of groups that performed the payment_received event after a single user from the group performed the subscription_started event.
Measurement types
By default, Mitzu measures the retention rate of users who performed the initial and retaining events. However, you can change this behavior by selecting a different measurement type.
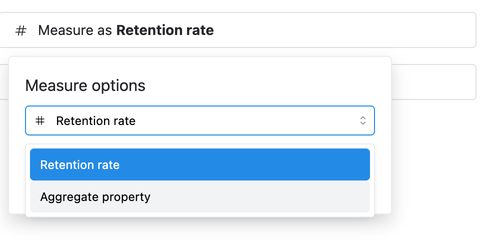
Mitzu supports the Aggregate property measurement type. As with funnels, this configuration makes Mitzu aggregate any property from the last step (the retaining step).
For example, in our case above, we can select the Aggregate property measurement type and choose the Sum aggregation function with the Price event property of the payment_received event.
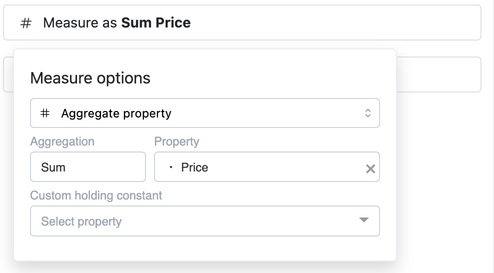
This visualizes the total retained revenue month over month.
Returning on or after vs. returning on specific days
This configuration controls how Mitzu considers users retained.
If you select Returning on or after, Mitzu considers users retained if they performed the retaining event during or after the retention period.
Consider an app with sporadic usage where every user opens it once a month.
If I visualize the week-over-week retention rate of users who open the app on the last day of the month, for three weeks I would see a drop in the retention rate. To reduce this noise, you can apply the Returning on or after configuration. This makes Mitzu consider each week before the retaining event as a retained week.
In contrast, the Returning on specific days configuration makes Mitzu consider users retained only for the exact time period (week, month, etc.) in which they performed the retaining event.
Retention attribution
This setting allows you to choose the attribution of the retention. It has no visible effect on the "Retention rate" aggregation type (which is the default aggregation type).
Currently, we support two types of retention attribution:
- Every event - each event is considered a "retaining" event of the retention insight.
- First event - only the first event of the retaining step (segment) is considered a retaining event.
Loose timestamp comparison
Retention often combines events from different sources — for example backend and frontend events — whose clocks are not always perfectly aligned for the same user interaction. When that happens, a retaining event that logically falls inside a retention period can land a few seconds before the period start and the user is counted as not retained for that period.
Enable Loose timestamp comparison (the checkbox in the retention period menu) to allow a 1 minute grace period when deciding whether a retaining event falls within a retention period. With it on, a retaining event can happen up to 1 minute before the period start and still count.
The grace period only relaxes the start of each retention period, so returns never leak across adjacent buckets. The default value comes from your project's insights settings and can be overridden per retention insight.
On ClickHouse the grace period is not applied — loose timestamp comparison only counts events at the exact period start (>=). Other warehouses use the full 1 minute grace.
Trend vs. overall measurement configuration
As discussed in our example above, retention insights also support trend and overall measurement configurations.
Retention trends are called daily/weekly/monthly trend. Once selected, they help you understand how your retention rate changes over time.
Overall retention shows how the passage of time affects the retention rate for users who performed the initial event and then repeatedly performed the retaining event.
Cut off incomplete periods
Retention is particularly sensitive to "incomplete" cohorts: users who entered the retaining event recently haven't had a chance to retain in later periods, so their cells in the retention table look like drop-offs.
The Cut off incomplete periods toggle in the More menu hides those cells so you don't have to mentally discount them. We recommend enabling it whenever you share a retention chart externally.
Data sampling
Retention queries are sensitive to long time horizons. Mitzu can downsample the events it reads and the entities it analyzes to keep queries fast — see Data sampling and resolution for the full description of Event resolution and Uniques sampling.
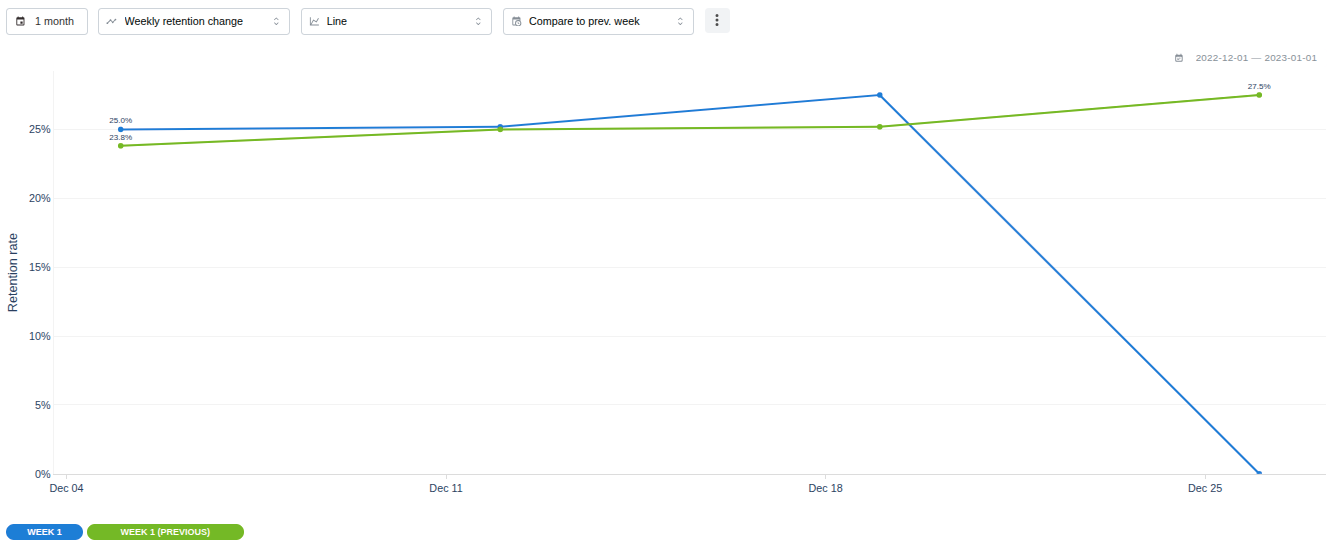
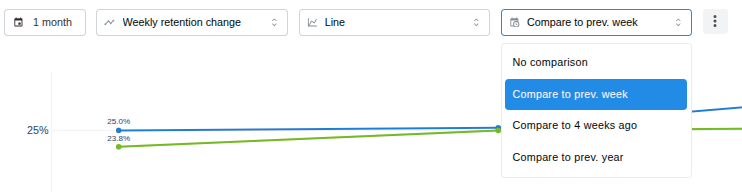
Comparison
The Comparison feature lets you analyze data trends by comparing them against those from a previous time period. For example, you can compare data points from the last month with data from the preceding month.
To activate the comparison, select the desired comparison window from the dropdown menu.
In retention analysis, comparisons are currently available using absolute values. Additional comparison methods will be introduced in future updates. For information about upcoming features, please contact us at support@mitzu.io.
Comparison with absolute values
When using comparison with absolute values, the chart displays both:
- the data points from the selected insight time window, and
- the data points offset by the chosen comparison time period.
This lets you view both trends simultaneously and identify changes or patterns between the two time windows.