Insights Basics
Now, let's dive into the basics of insight creation with Mitzu. We recommend reading this section before creating segmentation, funnel, retention, or journey insights.
Mitzu insights
Insights are the main building blocks of Mitzu. Currently, we support four categories of insights:
- Segmentation
- Funnel
- Retention
- Journey
You may be familiar with these from other marketing, sales, or product analytics tools. These insight categories let you create a wide range of metrics and KPIs for your business. This is also where you can dive into the behavior of individual users, groups, or cohorts.
Mitzu segment
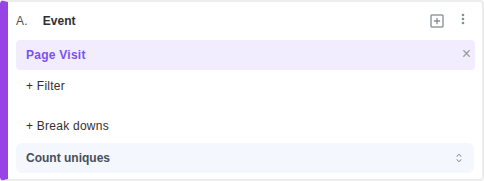
In this section, we will cover the most important concepts of the segments panel on the insights page.
A segment in Mitzu is a set of events performed by users or groups. A segment is the main building block of every insight in Mitzu. You construct insights by defining segments in the UI. A segment can be a single event you want to measure. For example: how many users visited your landing page?
However, filters are most often applied to segments. For example: how many users visited your landing page from a specific country?
You can combine multiple events into the same segment, e.g., page visits or sign-ups.
More about this later.
It is essential to understand segments to make the best use of Mitzu. You can interpret a segment as: "Find the users who performed X and Y actions matching these filter criteria."
You will often see different decorators on the segment panels, such as breakdown or count uniques.
These are not actually part of the segment definition; they are applied to the segments during analysis.
Subsegments
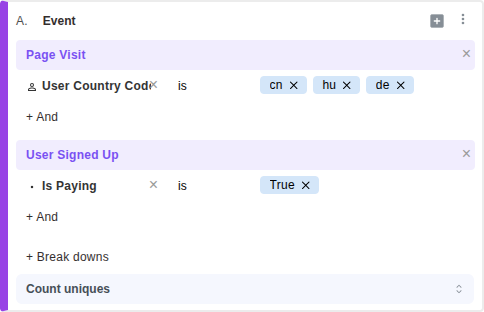
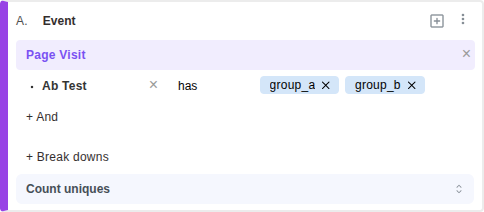
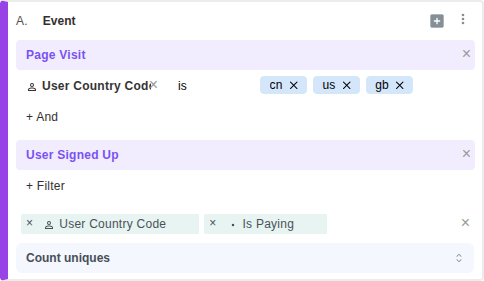
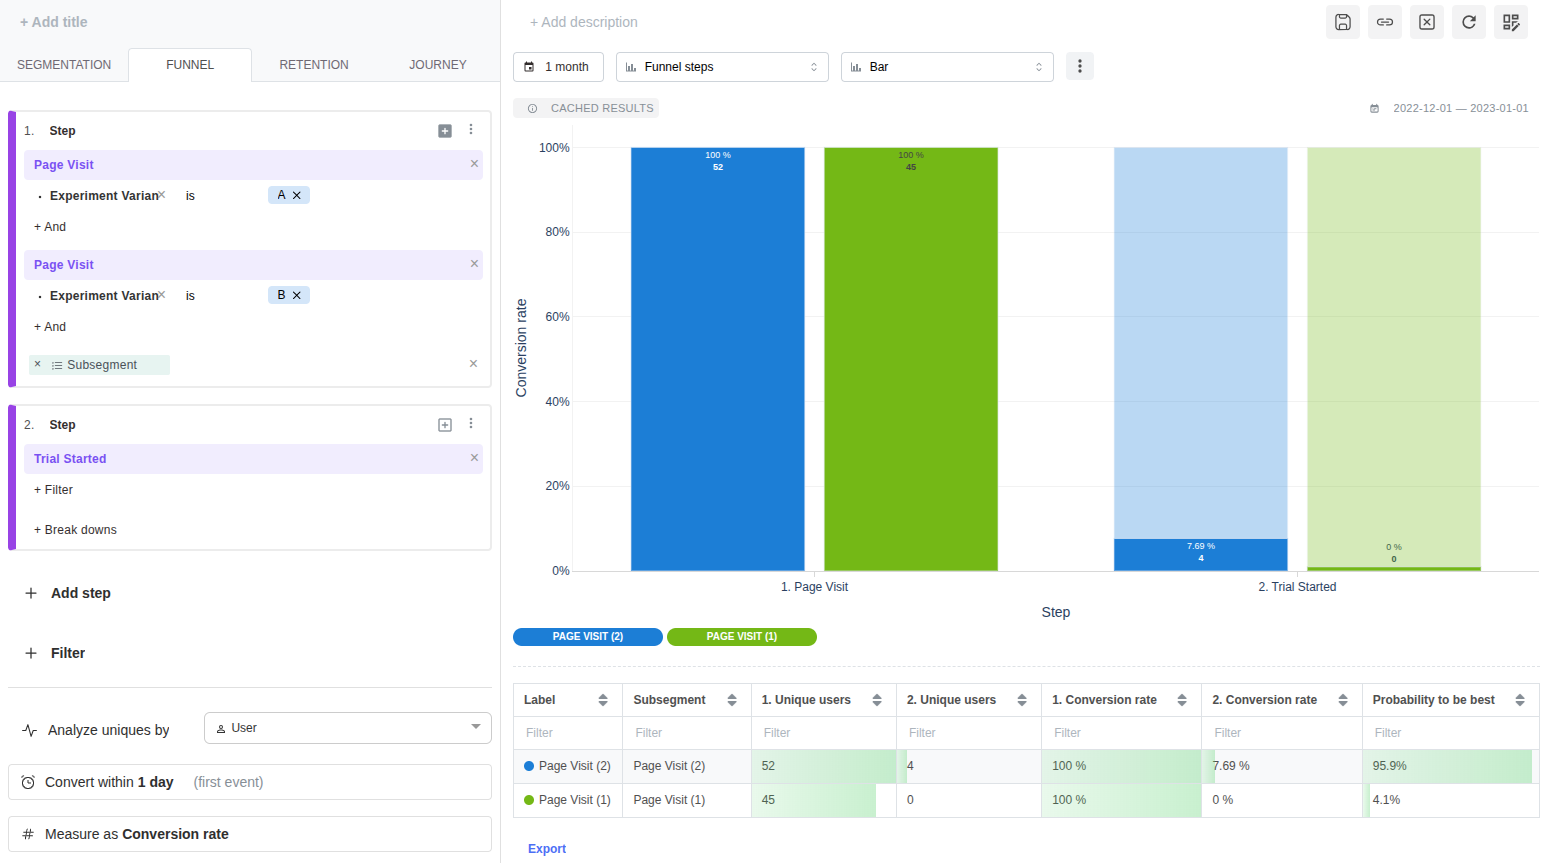
When we refer to a subsegment, we mean one of the sub-definitions of users that make up the segment. The best way to explain it is with an example. The following segment has two subsegments:
- Users who performed a
Page Visitevent (visited the landing page). - Users who performed a
User Signed Upevent and are currently paying.
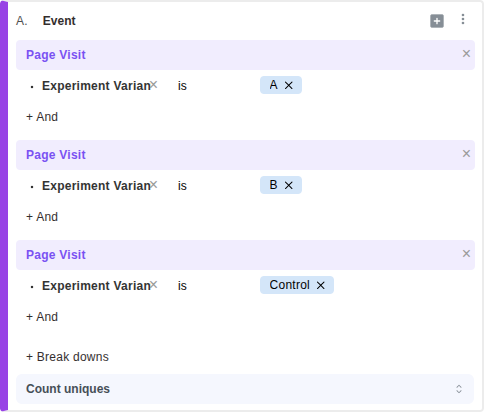
Using the same event twice to build two subsegments is very common, for example, during experimentation (A/B test) analytics.
As you will see later, funnels and retention insights benefit greatly from subsegments.
You can add subsegments with the + button at the top of the segment panel.
You can add as many subsegments as you want.
Combining events into a single subsegment
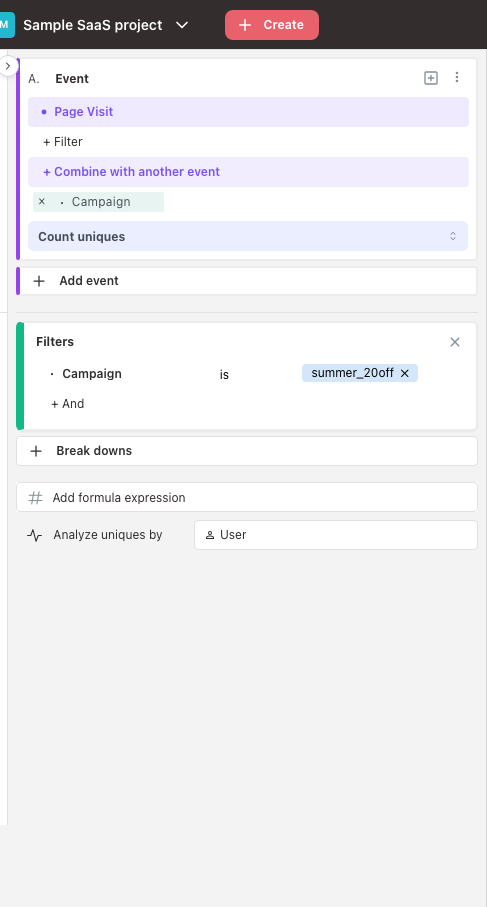
Within a single subsegment, you can combine multiple events with an OR operator using the Combine events button on the subsegment header. This is useful when you want to treat several different events as the same step — for example, "Page Visit OR Email Click" — without splitting them into separate subsegments.
Combined events inside a subsegment are joined with OR. Filters set on each combined event still apply with AND to that event's own conditions.
Hiding segments
In segmentation insights, each segment has a hide/show toggle in its menu. Hidden subsegments are kept in the configuration but excluded from the chart and table — useful for temporarily comparing variants without losing the segment definition.
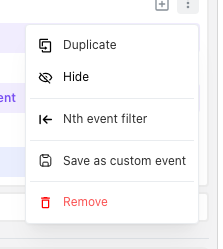
Saving a segment as a custom event
If your workspace has custom events enabled, the segment menu offers a Save as custom event action. The saved event becomes reusable across insights as if it were a regular event.
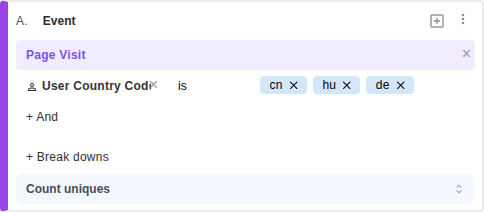
Event filters
Event filters are also among Mitzu's most important concepts. They are used to narrow down segment definitions.
As you can see above, there are multiple types of filters. We will explore each of them in the following sections.
When event filters are stacked in a subsegment, they are combined with an AND operator.
Between two subsegments, they are combined with an OR operator.
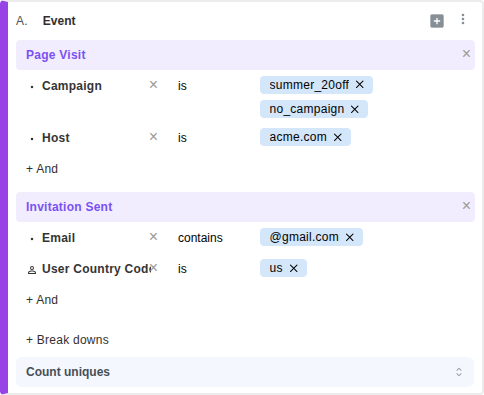
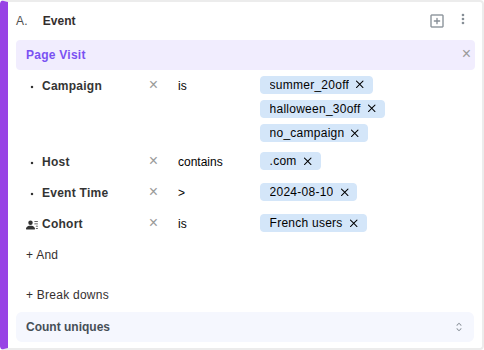
In the example above, this is how you can interpret the filters:
Select all users who
viewedour sites coming from one of the twoCampaignsand where the site hostname isacme.com, or performed anInvitation Sentoperation with an@gmail.comand whoseUser Country Codeisus.
Event property filters
The most common property filters are the event property filters.
These are marked with a . in the filter dropdown.
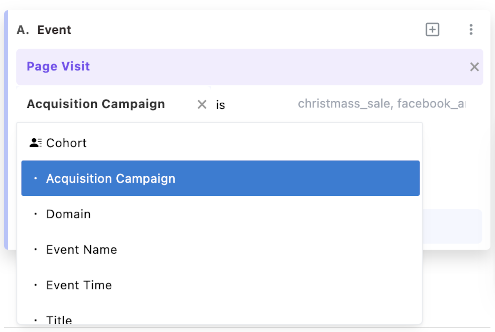
Event property filters exclude users who didn't perform the events matching the given filter condition.
Mitzu collects event properties for each event during the table indexing process. If tables in your data warehouse change, you must re-index the event tables to reflect the changes.
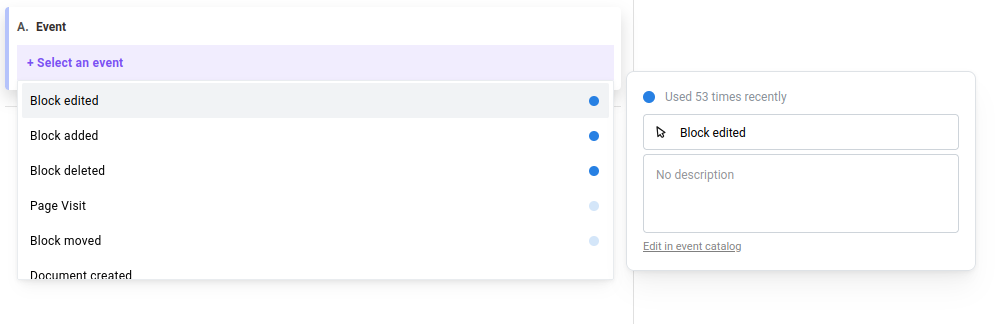
Recent Event Usage Indicator
The blue circles in the event selection dropdown indicate recent usage frequency for that specific event. The number of times an event has been used recently is also shown when you hover over the event.
Complex event properties
Mitzu supports complex event properties. Complex event properties are event properties nested inside other event properties. For example, you can have a user_properties event property containing nested country_code and language event properties.
Mitzu shows these properties in the following format in the property filter dropdown:
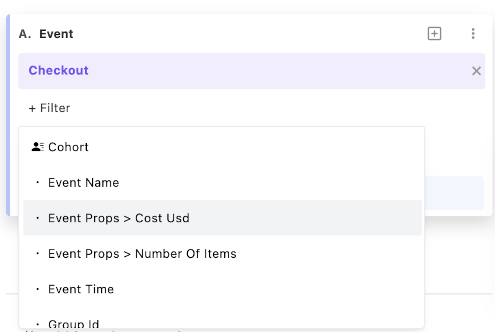
In the example above, we have an Event props event property containing nested Cost Usd and Number of items properties.
Properties can be renamed on the catalog page.
User and group property filters
User and group properties are not bound to specific events. The user and group profile tables are the source of these properties. In the property filter dropdown, you will see the User Property and Group Property options with the following icons:
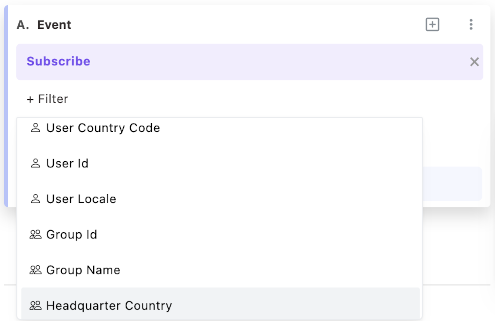
If you filter on these properties, you directly narrow down the users based on their properties. Groups are associated with a set of users, so filtering on a group property filters on the corresponding set of users.
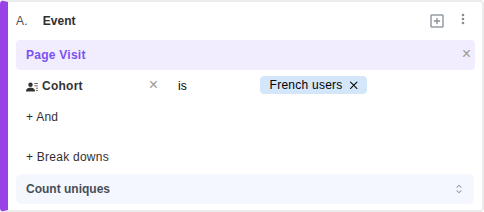
Cohort filters
A cohort is a "cherry-picked" set of users. You can create cohorts in Mitzu in multiple ways:
- Import from a CSV file
- Create a cohort on the chart on the insights page
- Create a cohort on the lookup page
Cohort filters scope an insight to the "cherry-picked" set of users, or filter your insights for users that are not in the "cherry-picked" set.
What is the difference between a cohort and a segment of users?
Both refer to a set of users. However, a segment is a set of users who share a common property, such as:
- Country
- Language
- Gender
- Age
- etc.
A cohort is a set of users that doesn't necessarily share a common property. For example, two users who don't share a single property can still be in the same cohort.
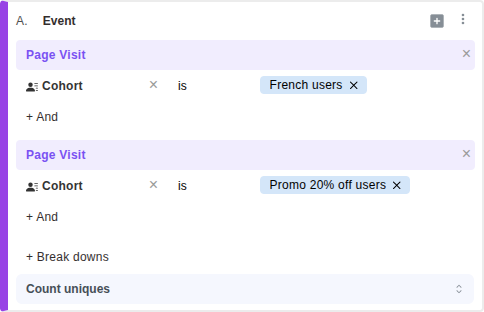
You can stack cohort filters in the same subsegment. This is useful when you want to filter for users who belong to two cohorts.
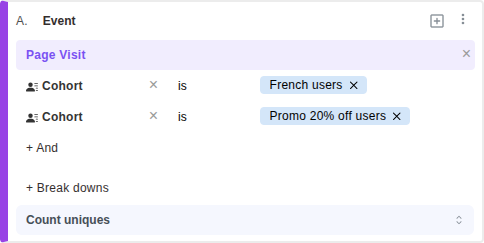
Selecting users in one of two cohorts is equivalent to selecting users in two segments.
Filter operators
The available operators depend on the property filter type and the type of property data.
Event, user, and group property filters have the following operators available:
- Scalar data types (integers, float, dates):
Is- Property is equal to any of the values listed for the filterIs not- Property is not equal to any of the values listed for the filter>- Property is strictly greater than the single value selected for the filter<- Property is strictly less than the single value selected for the filter>=- Property is greater than or equal to the single value selected for the filter<=- Property is less than or equal to the single value selected for the filterPresent- Property has some value in the eventMissing- Property has no value in the event
Date and time filters are also supported. To type a specific date or time, use the YYYY-MM-DD or YYYY-MM-DD HH:MM:SS ISO formats.
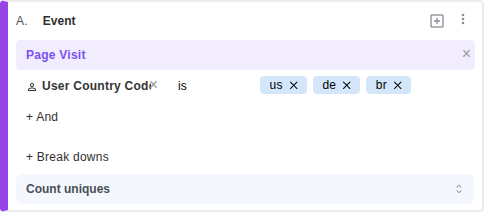
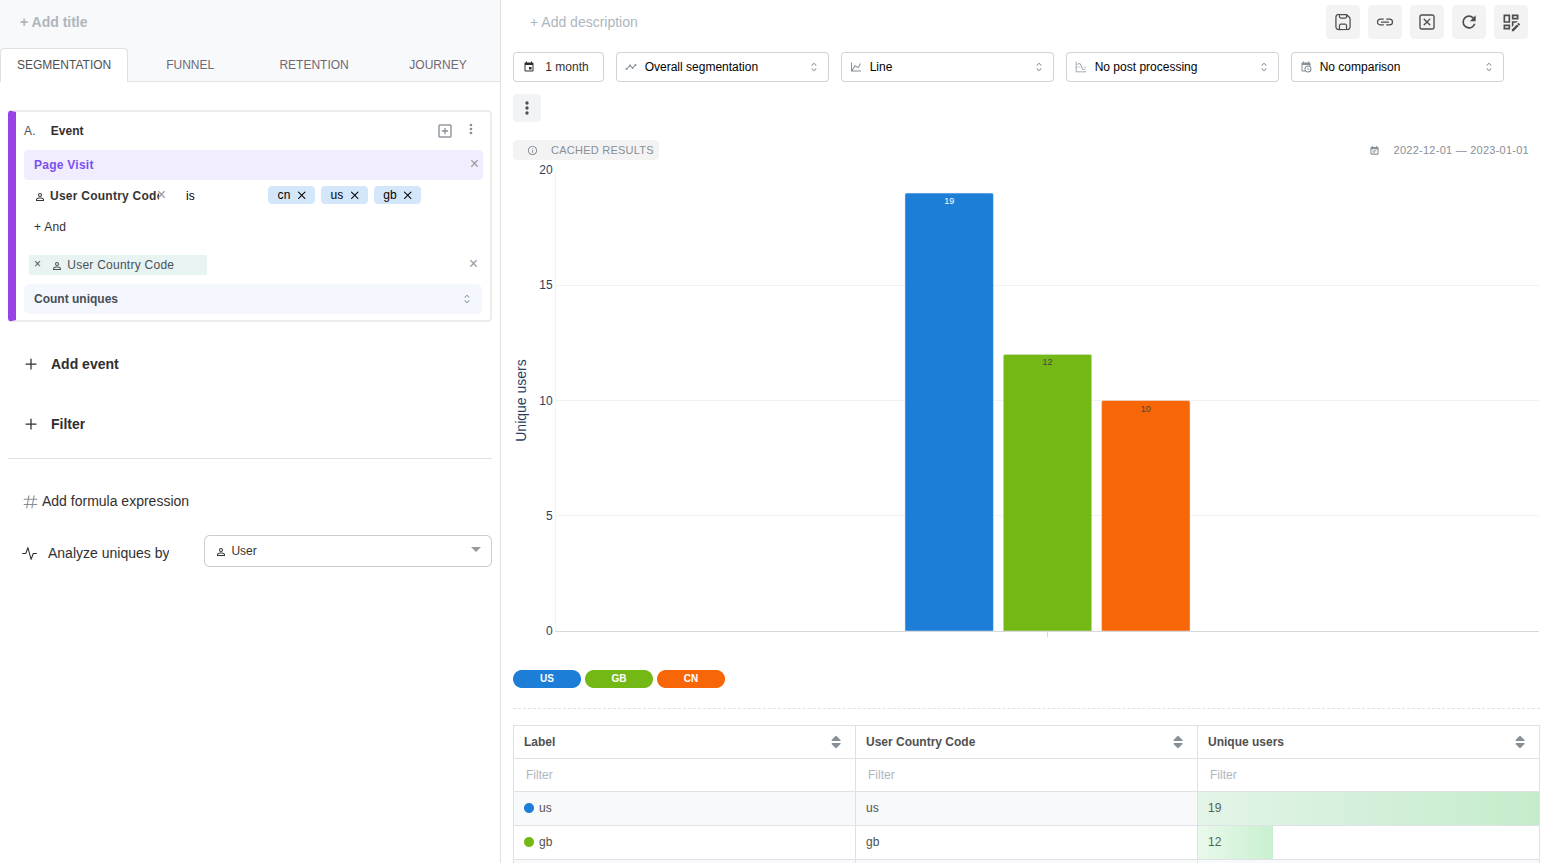
The example above selects users who performed a Page Visit event and whose country codes are any of the following: gb, br, de, in.
- String data type:
In addition to the operators above, the following operators are available:
Contains- The value of the event property contains any of the values listed for the filterNot contains- The value of the event property does not contain any of the values listed for the filter
The >, <, >=, and <= operators are also available for string data types.
They compare string values based on the ASCII codes of the characters.
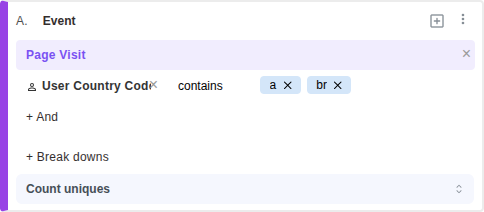
The example above selects users who performed a Page Visit event and whose country codes contain either of the following letters: a or b.
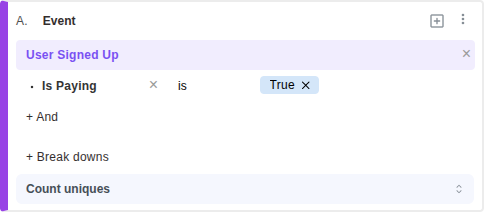
- Boolean data type:
The following operators are available for boolean data types:
Is- Property is equal to any of the values listed for the filterIs not- Property is not equal to any of the values listed for the filterPresent- Property has some value in the eventMissing- Property has no value in the event
- Array data type:
Array data types in Mitzu are special. Mitzu currently supports arrays only with scalar and string element types. Complex types are not supported inside arrays. The following operators are available for array data types:
Has- The array value of the event property contains any of the values listed for the filterDoesn't have- The array value of the event property does not contain any of the values listed for the filterValue like- At least one element of the array matches one of the SQLLIKEpatterns listed for the filter (use%as a wildcard)Value not like- No element of the array matches the SQLLIKEpatterns listed for the filterPresent- Property has some value in the eventMissing- Property has no value in the event
Segment filters
Segment filters are applied to the entire segment. They are most often used to select specific events in the sequence of events triggered by users.
Currently, we support the Nth event filter.
This helps you:
- Pinpoint the Nth instance of a user action
- Identify customers based on the number of times they've performed a critical action
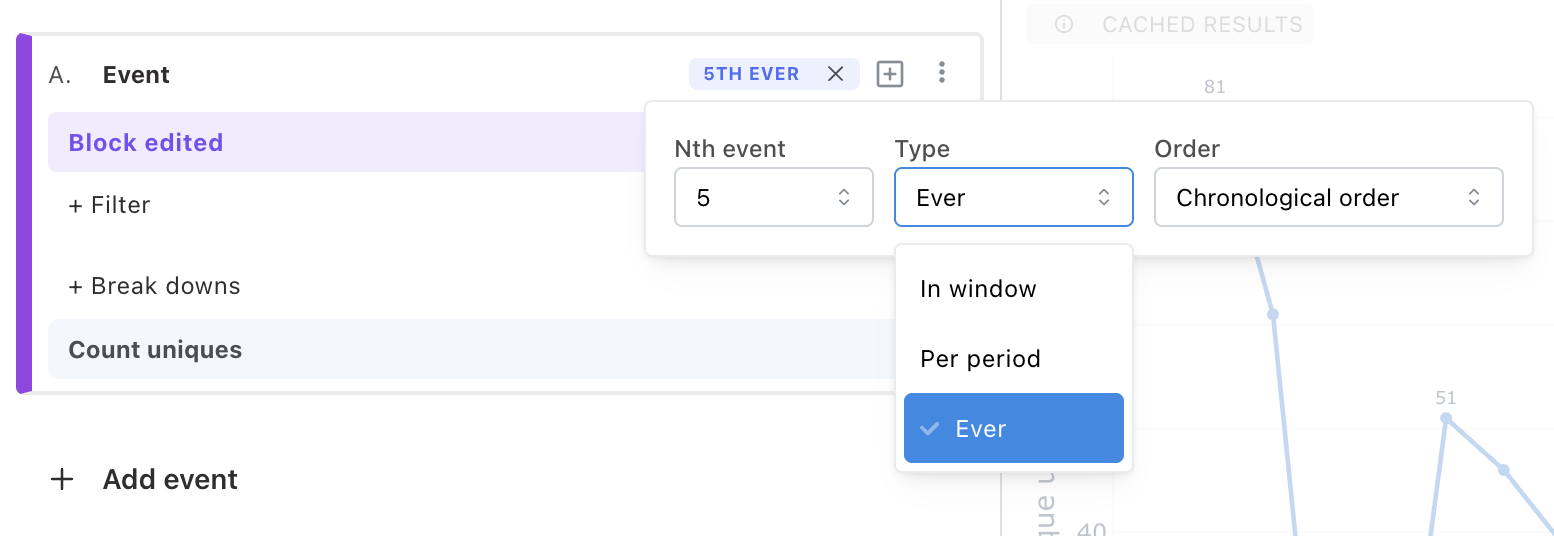
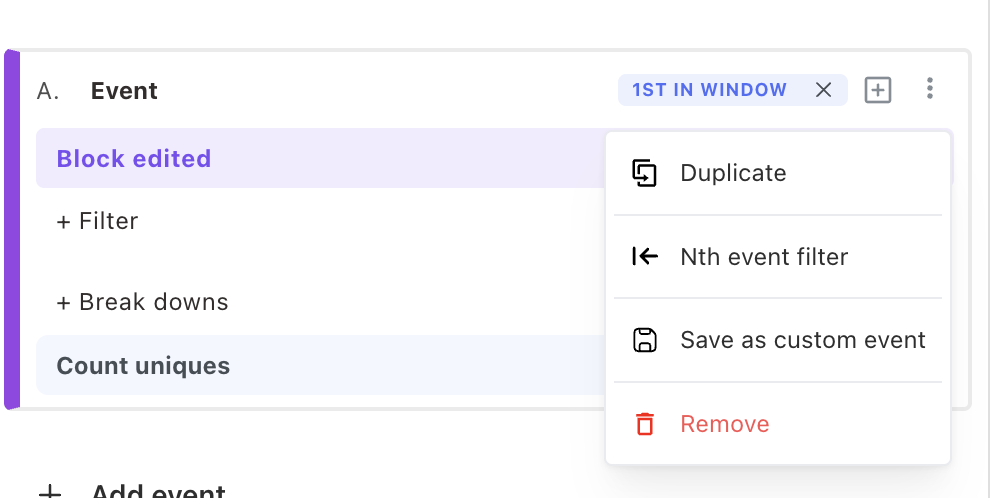
To enable this segment filter, click the Nth event filter button in the segment menu.
With the Nth event filter, you can easily capture each Nth instance of any user action (up to the 100th). This helps you quickly pinpoint and resolve areas of friction for first-time users so you can boost your overall North Star metric.
You can also use it to identify your best customers based on the number of times they've taken a critical action in your product, like completing a purchase on an e-commerce platform or playing a song in a music streaming app.
Segment filters don't only work with user as the subject. You can use them with any entity present in your data.
Groups are typical candidates for segment filters, and so are sessions, etc.
We will cover this topic in more detail in the Analyze uniques by? section.
Understanding Segment Filters
The following image highlights which user event is selected for each segment filter. Consider this situation for our actor:
- Their activity occurs during the first four months of 2024.
- The time window we are looking at starts on January 15, 2024, and ends on March 15, 2024.
- We are looking at Segmentation with Monthly Trends.
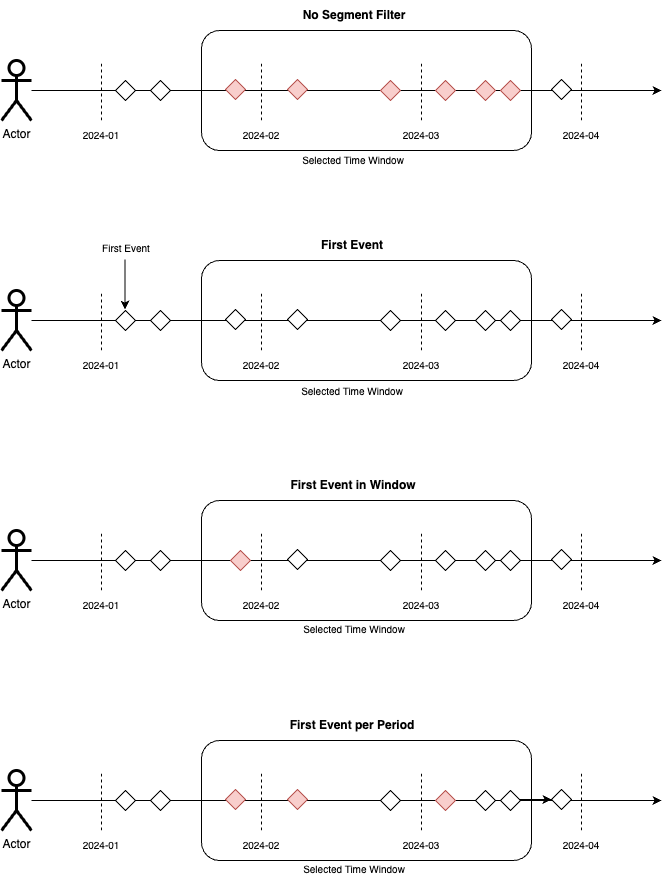
- No segment filter: all 6 events inside the selected time window are considered.
- First event: none of the events are considered, because the actor's first event happened before the start of the time window.
- First event in window: only 1 event is considered, which is the last event of the user in January.
- First event per period: only 3 events are considered: the last event of the user in January, the first event in February, and the first event in March. These are the first events in each period, which corresponds to our months.
Segment breakdowns
Breakdowns are powerful tools for understanding how your users behave across the different subsegments that make up the segment.
You can add as many breakdowns as you want. If you combine two or more events on the segment panel, you will see the combined properties of all of those events.
You can use any event, user, or group property as a breakdown except properties with an array type.
Breakdown with subsegment index
In segments that contain multiple subsegments, the breakdown dropdown shows subsegment as an option.
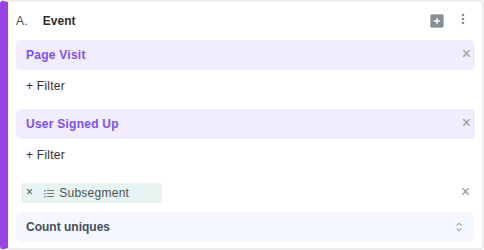
This option breaks down your segment analysis by the index of the subsegment. This is very useful when you want to compare the behavior of users who performed the same event with different property filters.
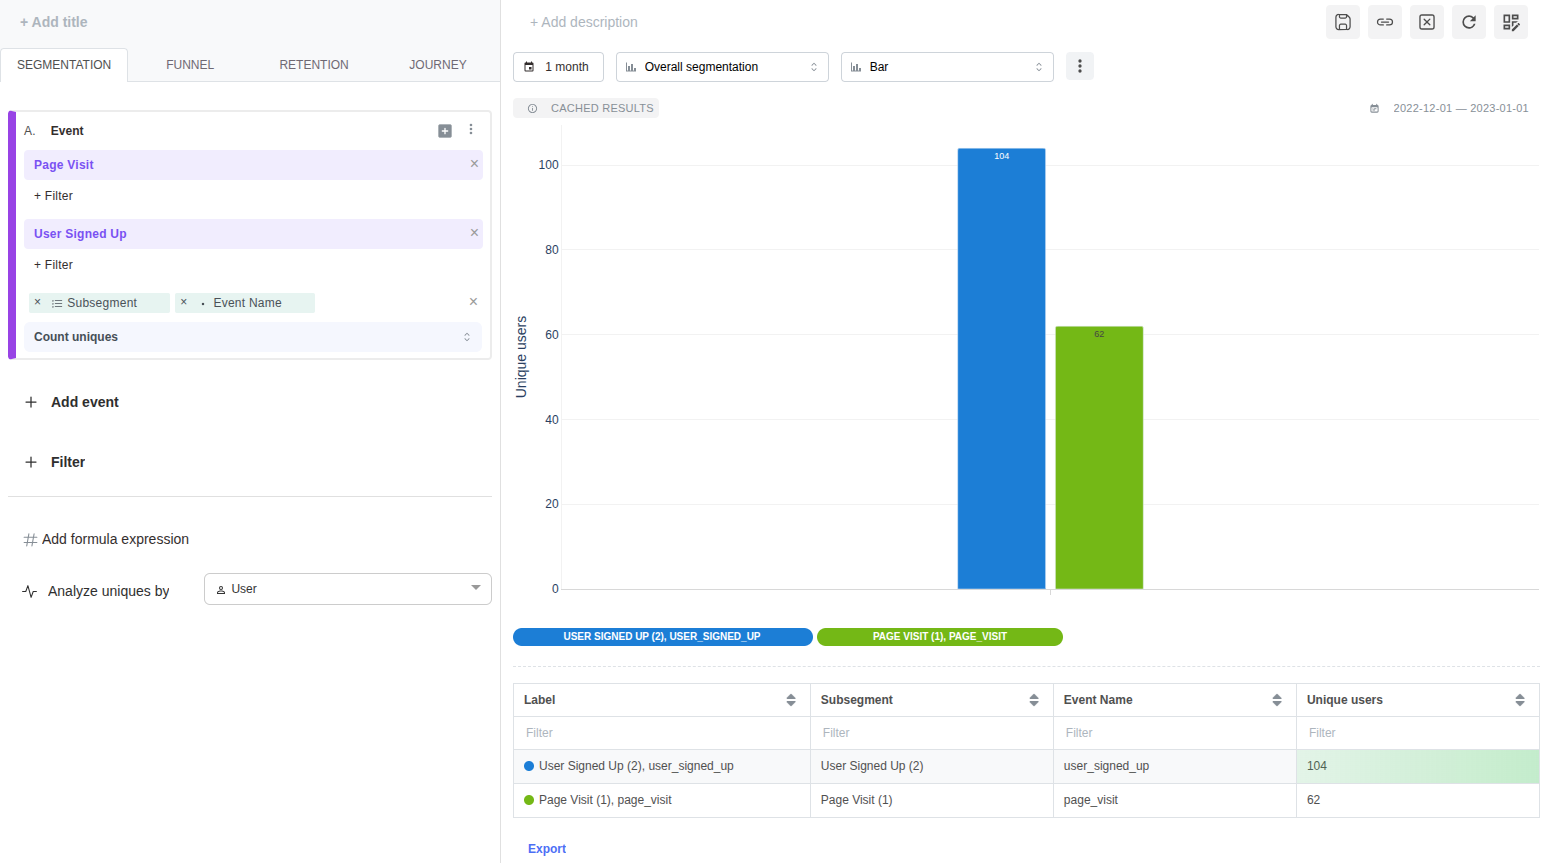
A great example of this is funnel analysis for A/B test variants.
Breakdown by frequency
The breakdown dropdown also offers a Frequency option under Other breakdowns. It breaks down your analysis by the occurrence order of the event for each user within the analyzed date range: their 1st event, 2nd event, 3rd event, and so on.
The frequency buckets are labelled with plain numbers (1, 2, 3, …), where 1 is each user's first occurrence in the range, 2 the second, and so on. Occurrences are always counted chronologically (oldest first), regardless of any first/last-event filter on the segment.
This is useful for questions such as "how does behavior differ between a user's first purchase and their repeat purchases?" — a segmentation broken down by frequency shows one series per occurrence number.
You can combine Frequency with other breakdown properties; the frequency bucket is always applied last. Frequency works with segmentation, funnel (conversion), retention, and journey insights.
Clicking a frequency bucket in a chart (for example to filter, zoom in, or create a cohort) narrows the analysis to that specific occurrence — equivalent to a "nth event in the time window" filter.
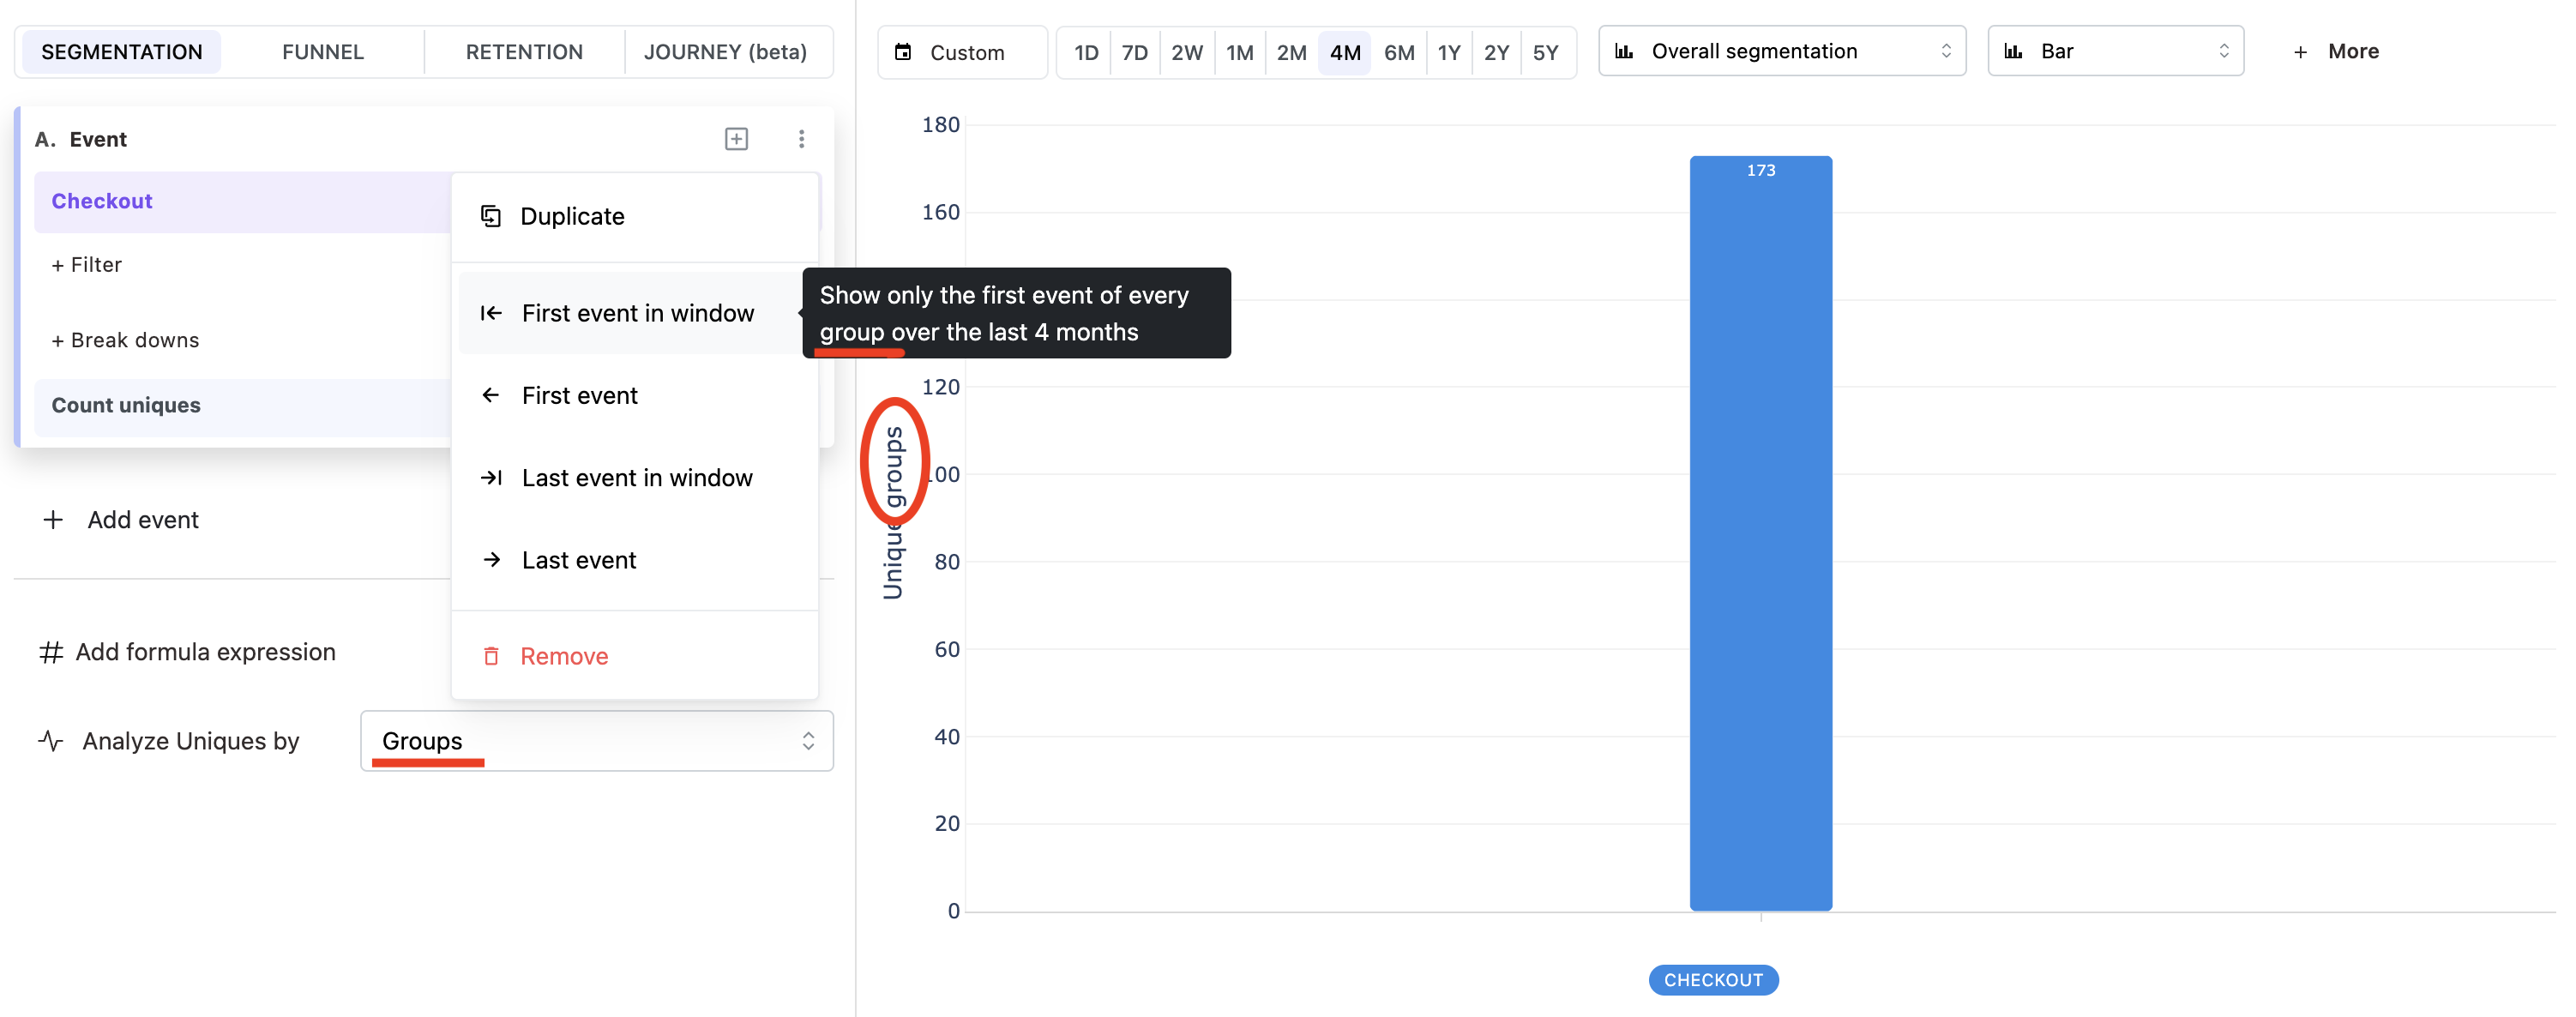
Analyze uniques by?
"Analyze uniques by" is an essential concept in insight creation. You can set the entity that Mitzu performs the analysis on. The two most common entities are users and groups, but you can select any entity in your data as the core entity.
By default, Mitzu selects the users entity for any analysis. This means each insight is built around users.
In other words, you will analyze the behavior of user segments.
If you select groups as the core entity, you will analyze the behavior of group segments.
Mitzu performs segment filters and measurements on the entity selected in the Analyze uniques by dropdown.
Mitzu also performs chart interactions on the selected entity.
Insight configuration
This section will cover the most important configuration options on the insights level.
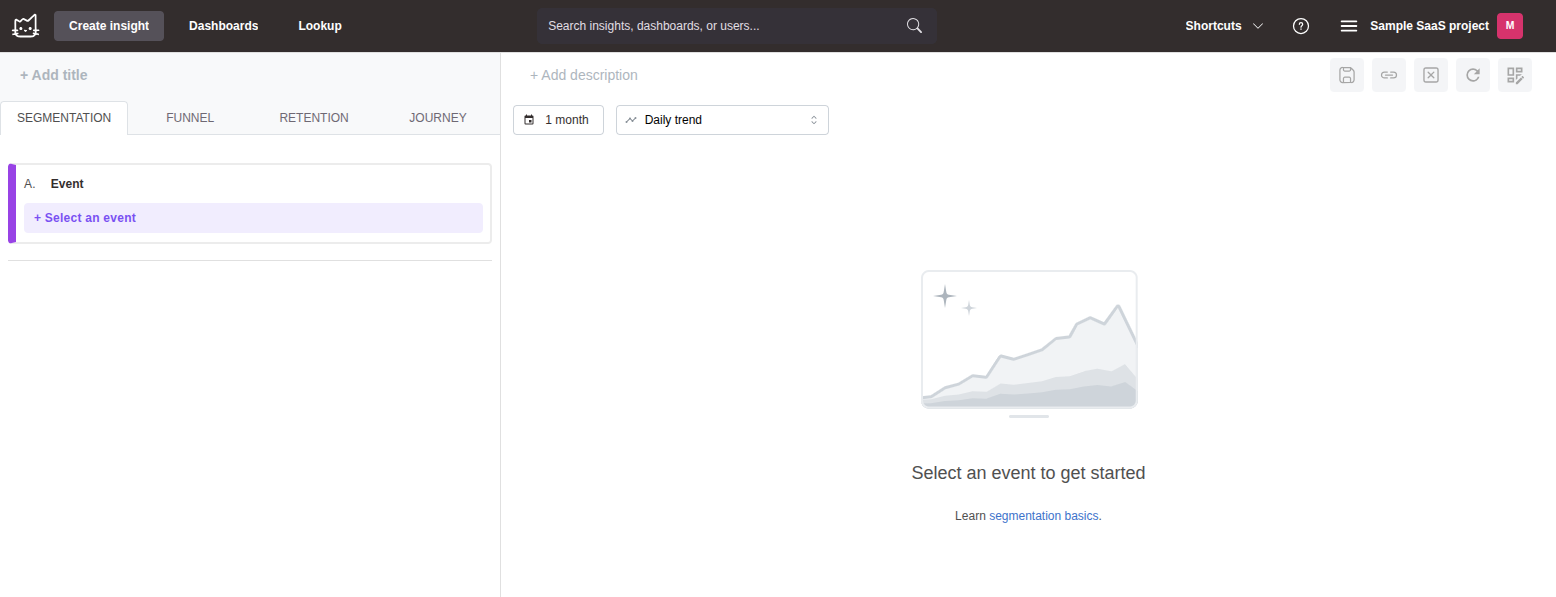
Choosing the time window
You will see the time window configuration component in the top center section of the insights page.
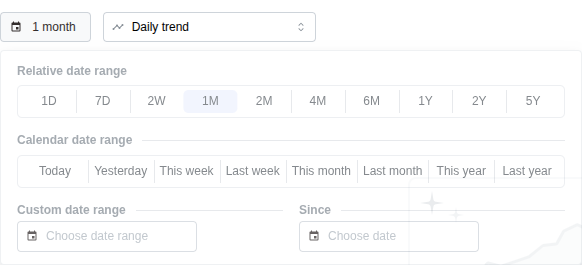
With this component, you can choose the time horizon for your analysis. You can choose between:
- a relative time window:
- relative date range (e.g.,
1 month,1 week,1 day, etc.) - since date (e.g.,
since 1st of January 2024 to now)
- relative date range (e.g.,
- an absolute time window:
- calendar date range (e.g.,
This week,This month,This year, etc.) - custom date range (e.g.,
1st of December 2023to1st of January 2024)
- calendar date range (e.g.,
Relative time window
The relative time window measures the time horizon from the default end date config, which you can find on the Workspace settings page.
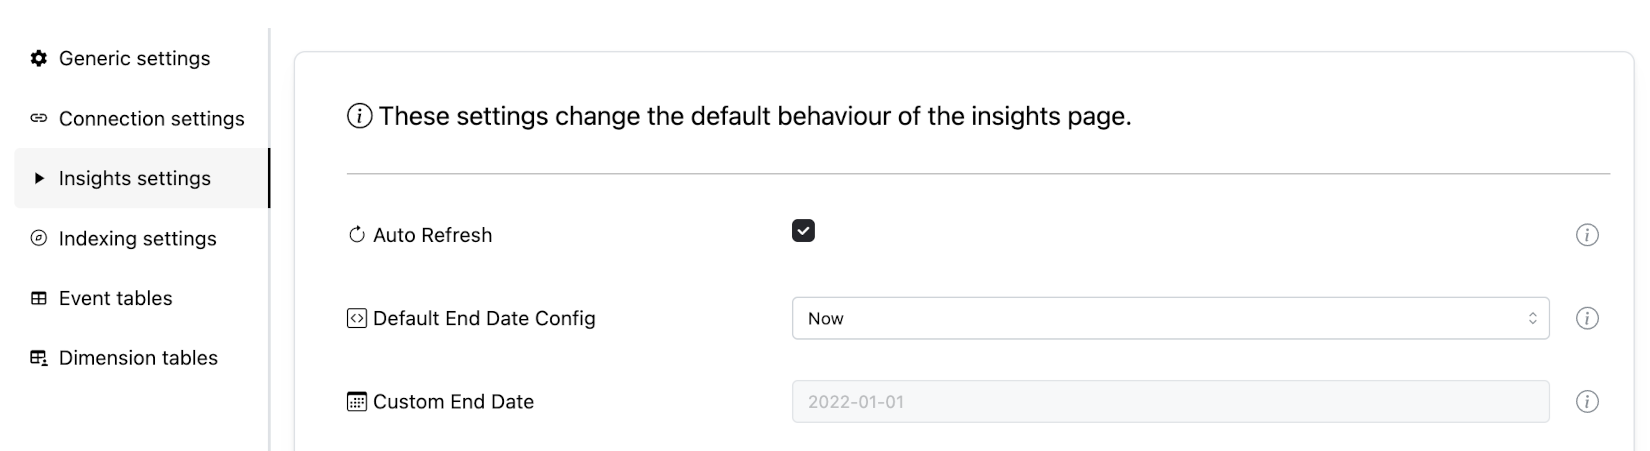
Suppose you've set your default end date configuration to Now. Mitzu measures the time horizon for the analysis up to the current second. Similarly, if you set the default end date config to Start of the current day, the time horizon is measured up to the start of the current day, and so on.
Adjusting the time horizon for trends
If you choose to analyze your insights as "trends", the granularity of the trend also affects the time horizon.
For example, if you choose to analyze your insights as "weekly trends", the start date for the analysis will be the first day of the week (Monday), which is treated as the beginning of the time horizon based on the relative time window. Similarly, Mitzu truncates the start date of the time horizon for the Month and Year time window options.
Consider the following example:
- The time horizon is set to
1M- 1 month. - The default end date config is set to
Start of the current day. - The insight type is set to
Weekly trend. - The current date is
1st of September 2024.
Normally, the time horizon would start on Thursday, the 1st of August 2024. However, since we are looking at the weekly trend, the start date is adjusted to the Monday of the week containing the 1st of August 2024.
So the final start date for the analysis will be 29th of July 2024.
Adjusting the time horizon for trends is important; without it, you would see misleading results at the start of your analysis.
Excluding the most recent periods
Sometimes the current period is incomplete — for example, today's data is still partial, or the running week hasn't ended yet. Mitzu lets you exclude the most recent N periods from a relative time window so the analysis only covers fully-elapsed periods.
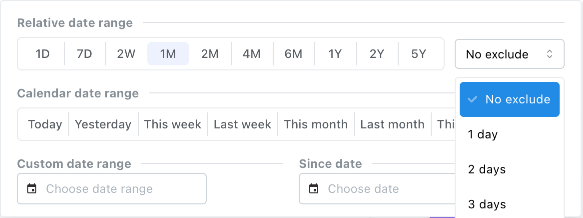
The exclude dropdown sits next to the lookback selector. The available exclusion sizes follow the chosen trend granularity (e.g., excluding 2 days on a daily trend, 1 week on a weekly trend). The selector is disabled for the Total aggregation, since there is no per-period granularity to skip.
Excluding periods only shortens the end of the analysis window — the start date stays anchored to the original lookback. For example, with a 1M lookback and 2 days excluded, the window ends 2 days ago but still starts 1 month before the default end date.
Custom date range
Clicking the Choose date range button opens a modal window where you can set the start and end dates of the custom time window for your analysis.
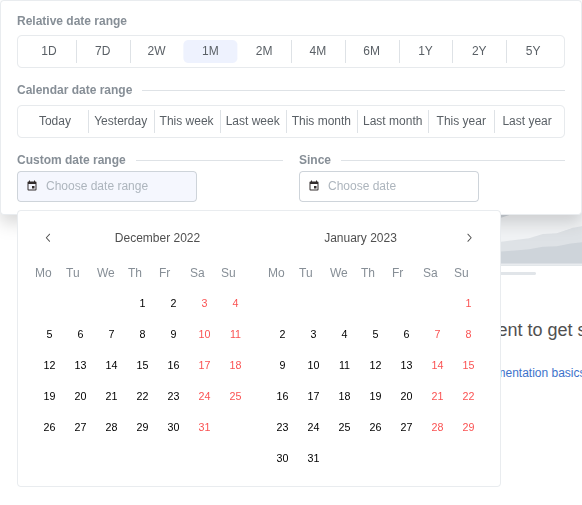
Custom time window dates are inclusive, meaning the entire day is included in the analysis.
You can also select a single day in the custom time window calendar.
Adjusting the time horizon for trends is also supported for custom time windows. For example, if you have chosen a start date other than Monday and choose to analyze your insights as "weekly trends", the start date for the analysis is adjusted to the Monday of the week containing the start date.
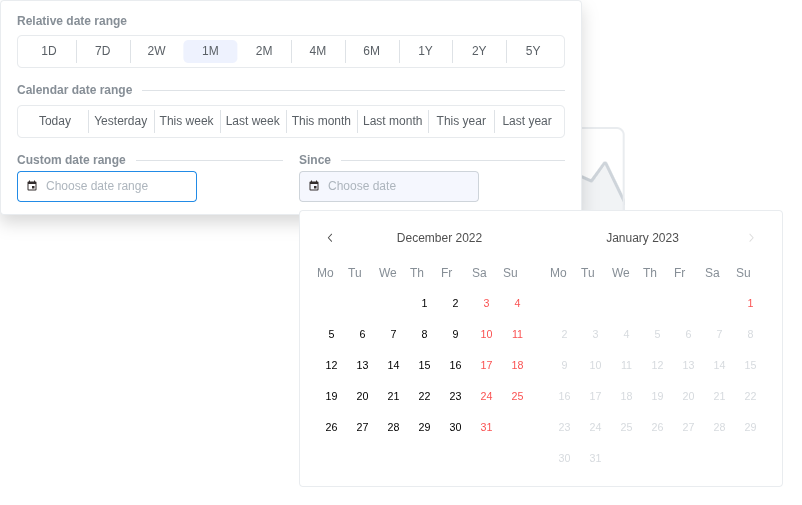
Since date
Clicking the Choose date button in the bottom right corner opens a modal window where you can set the start date of the since-date window for your analysis.
Trend vs. overall measurement configuration
You can select the trend vs. overall measurement configuration in the top center dropdown of the insights page.

Trend measurement types visualize the analysis as a change in measurement over the time horizon.
In contrast, Overall insight types visualize the analysis as a single value (in most cases) for the entire time horizon.
Currently, we support the following trend measurement types:
- hourly
- daily
- weekly
- monthly
- quarterly
- yearly
The default trend type is daily.
Not every insight type supports every granularity. For example, retention is limited to daily, weekly, monthly, and yearly trends, and quarterly is unavailable for funnels and journeys.
Selecting the chart type
Mitzu supports multiple chart types for each insight type (segmentation, funnel, retention, journey) and trend vs. overall measurement type.
Trend measurement types support the following chart types:
- Bar
- Line
- Stacked bar
- Stacked area
- Percentage stacked bar
- Percentage stacked area
- Heatmap (only in retention insights)
- Sankey (only in journey insights)
Overall measurement types support the following chart types:
- Bar
- Stacked bar
- Percentage stacked bar
- Horizontal bar
- Number
- Pie (only in segmentation insights)
- GEO charts (only for breakdowns with ISO2 or ISO3 country codes)
- Sankey (only in journey insights)
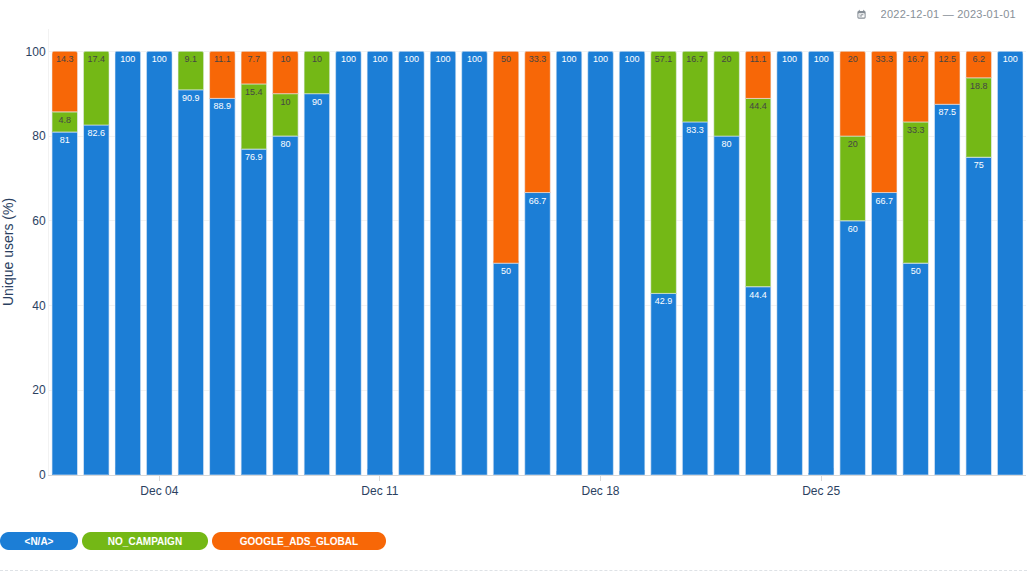
Percentage stacked charts
Percentage stacked charts normalize the values in your analysis to 100%.
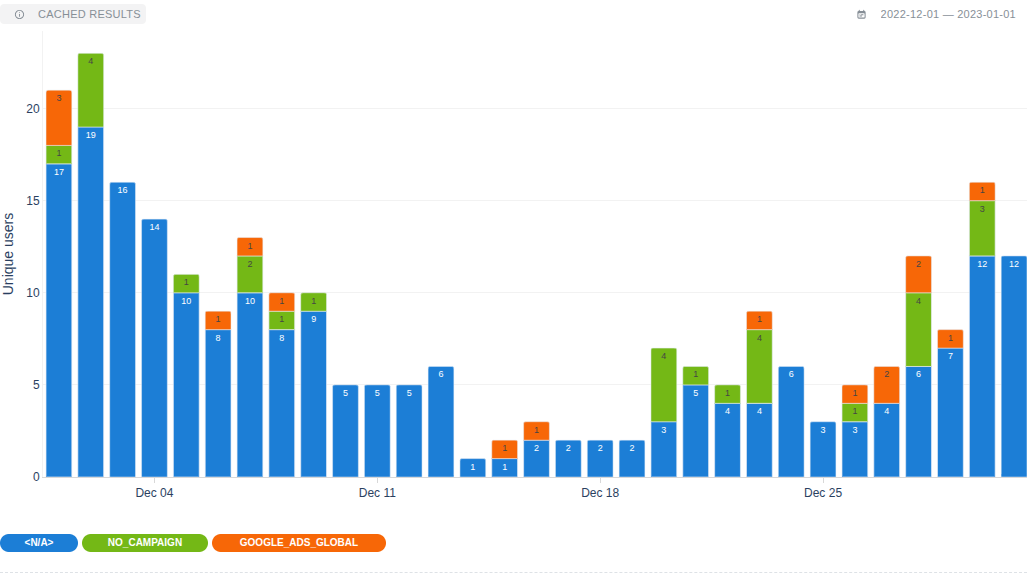
The same insight with regular stacked charts looks like this:
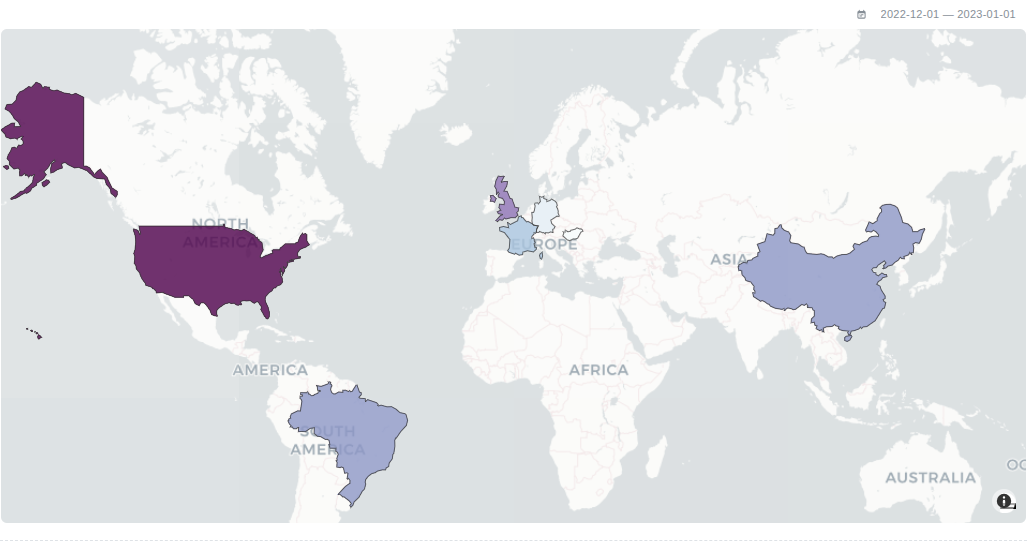
GEO Charts
Mitzu supports GEO charts in segmentation and funnel insights with a single breakdown by ISO2 or ISO3 country codes.
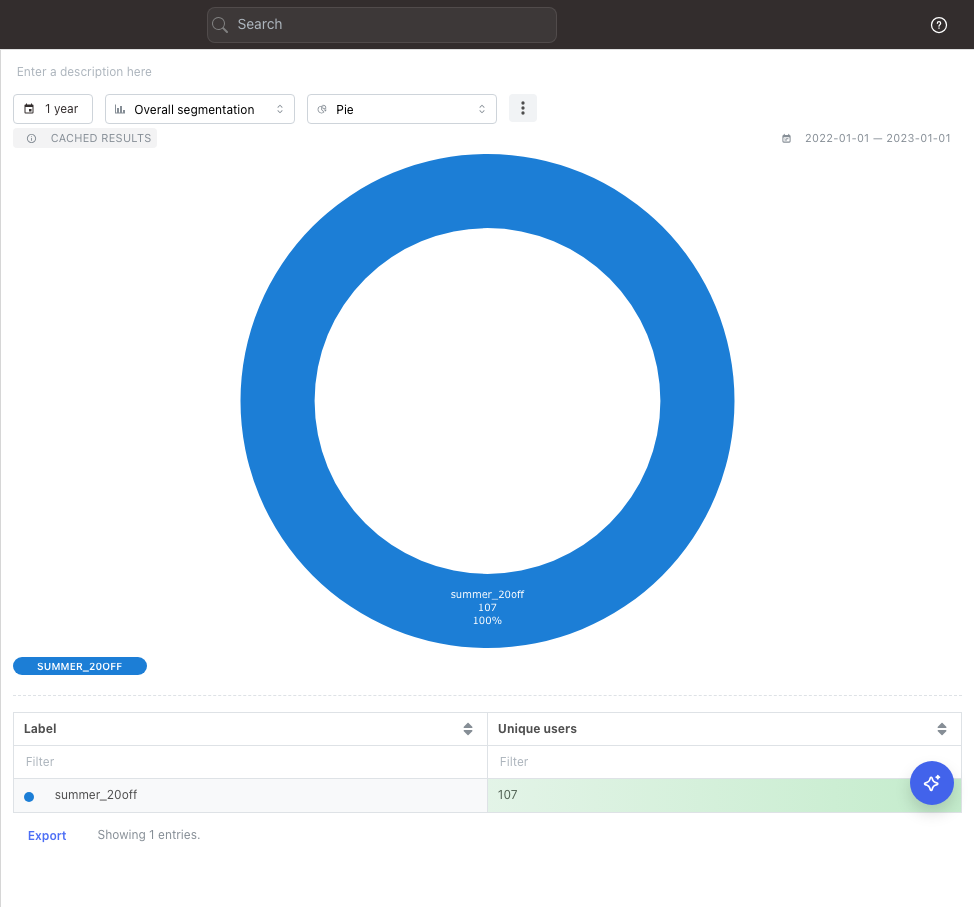
Pie chart
For overall segmentation insights, you can render the result as a pie chart. Each slice represents one segment (or one breakdown value if a breakdown is set). Use this when you want to communicate the composition of a single point in time at a glance.
Sankey chart
Sankey is the only chart type for journey insights. Each node represents an event step, and the link width represents the share of users moving from one step to the next. See the Journeys page for details.
Chart interactions
You can see the chart tooltip by hovering the mouse cursor over a data point on the chart.
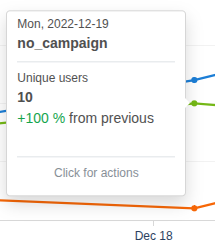
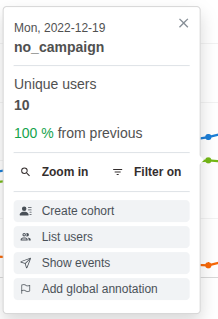
Depending on the insight and chart type, you can perform different operations on some data points on the chart. To open the menu, click a data point on the chart.
Zooming in and seeing trends
If your chart shows a data trend, you can zoom in on a single data point by clicking on it and then clicking the Zoom in button.
If your chart shows the overall result for a time window, you can click the See trends button to see the trends within a nearby time window.
Filtering on a group
If your insight contains a breakdown field, or multiple segments in the case of a segmentation insight, you can filter on one of the resulting groups by clicking a data point and selecting Filter on. This will open a new insight containing the necessary filters to show only the selected group.
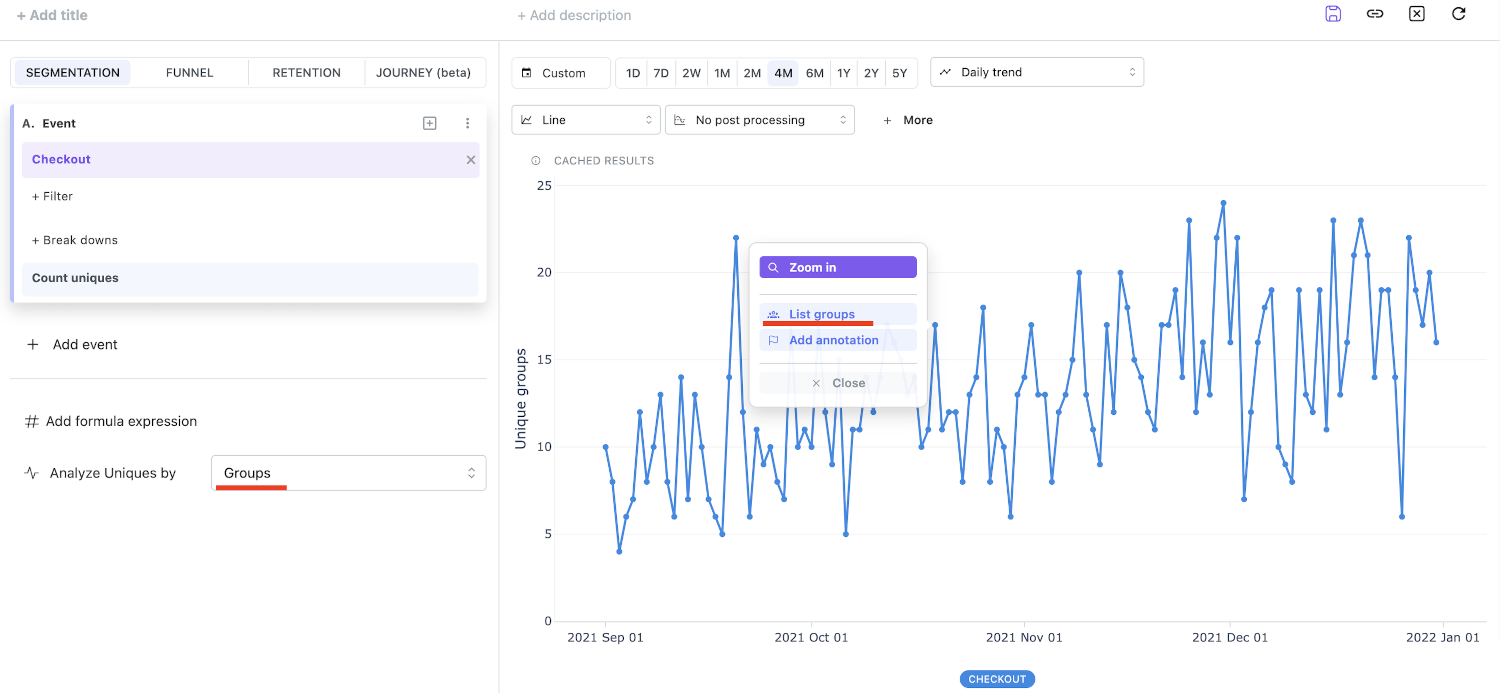
List users, groups
If you have selected either Users or Groups for Analyze uniques by, you can fetch the list of users or groups for the data point you've selected. Click the List users or List groups button to easily focus on a selected entity from the modal that opens.
The user (or group) profile modal lets you search and filter the entity's properties and recent events. If your workspace has an external profile URL configured, the modal also exposes a link that opens the corresponding profile in your CRM, support tool, or any other system you've connected.
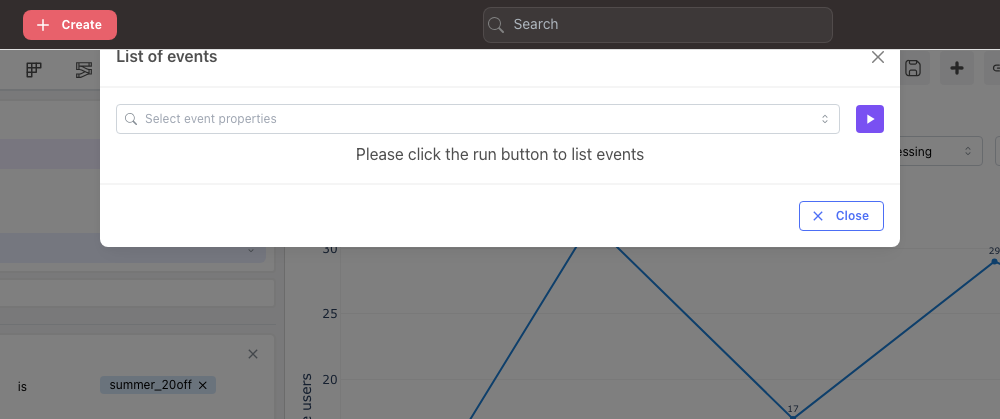
Show events
Show events opens a List of events modal showing the recent events behind the data point you clicked. You can pick any event property and the modal lists matching events in chronological order, so you can confirm exactly which events were counted into the chart value.
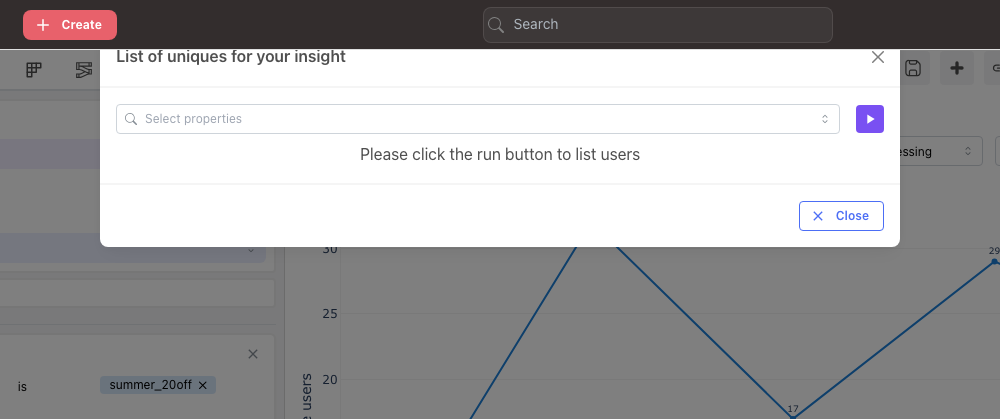
List of uniques (dimension table)
The List users / List teams button (the entity name comes from your Analyze uniques by selection) opens a List of uniques modal. When the insight has a breakdown, the modal lets you pick any property and lists every value that contributed to the data point along with the count of unique users (or groups) behind it.
Legend interactions
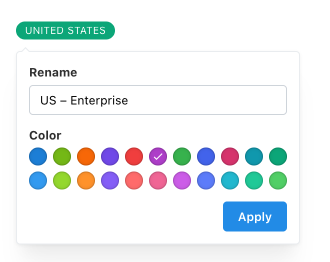
Each entry in the chart legend is an interactive chip. Click a chip to open its editor, where you can rename and recolor that series:
- Rename the series. Type a new label (up to 100 characters) and click Apply (or press
Enter). The rename is saved with the insight and is also applied to the table view and CSV export. - Recolor the series. Pick any swatch from the palette to override the color Mitzu assigned automatically, then click Apply. This is useful when two series would otherwise be drawn in near-identical colors.
To reset a single series, open its chip, clear the rename field (the label falls back to the original group name) and re-select its default color, then click Apply. To clear every rename and color override in one step, use Reset labels & colors in the More menu.
The + N chip at the end of the legend has a checkbox that toggles whether long-tail groups (everything beyond the top N) are bucketed into a single Other groups series.
Create a new cohort
You can create a new cohort from a given data point.
Create a new global annotation
If your chart type is not a GEO chart or heatmap, you can mark any date from the tooltip menu with a global annotation.
Data sampling and resolution
For funnel, retention, and journey insights, you can trade some calculation accuracy for faster query execution. The sampling controls live in the segment panel and combine two independent levers.
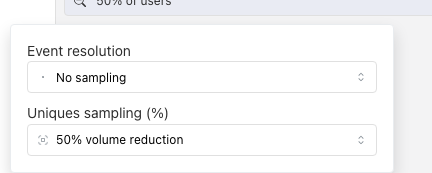
Event resolution
Event resolution downsamples the events Mitzu reads for the analysis. The available options are:
No sampling- every event is considered.One user event per minute- at most one event per user per minute is kept.One user event per hour- at most one event per user per hour is kept.One user event per day- at most one event per user per day is kept.
Coarser resolutions translate to dramatically faster queries on long time horizons but also reduce the precision of time-based measurements (for example "average time to convert").
Uniques sampling
Uniques sampling reduces the number of analyzed entities (typically users) instead of events. The supported levels are:
No sampling90% volume reduction- keep approximately 10% of entities.75% volume reduction- keep approximately 25% of entities.50% volume reduction- keep approximately 50% of entities.
Mitzu scales the resulting counts back up so that aggregated values remain interpretable. Uniques sampling is most useful for very large data warehouses where exploratory iteration would otherwise be slow.
Workspace-level defaults for both knobs come from the Event default resolution and Event auto sampling settings in Workspace settings. Mitzu also auto-picks a tighter resolution for funnels, journeys, and retention when your time horizon or conversion window grows beyond a few weeks.
Sampling does not apply to segmentation insights — segmentation always reads every event.
More options for insights
You can find options and actions for your insight in the More menu.
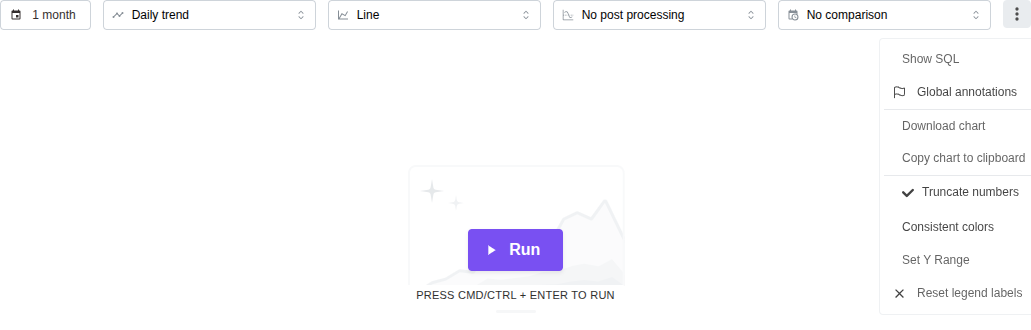
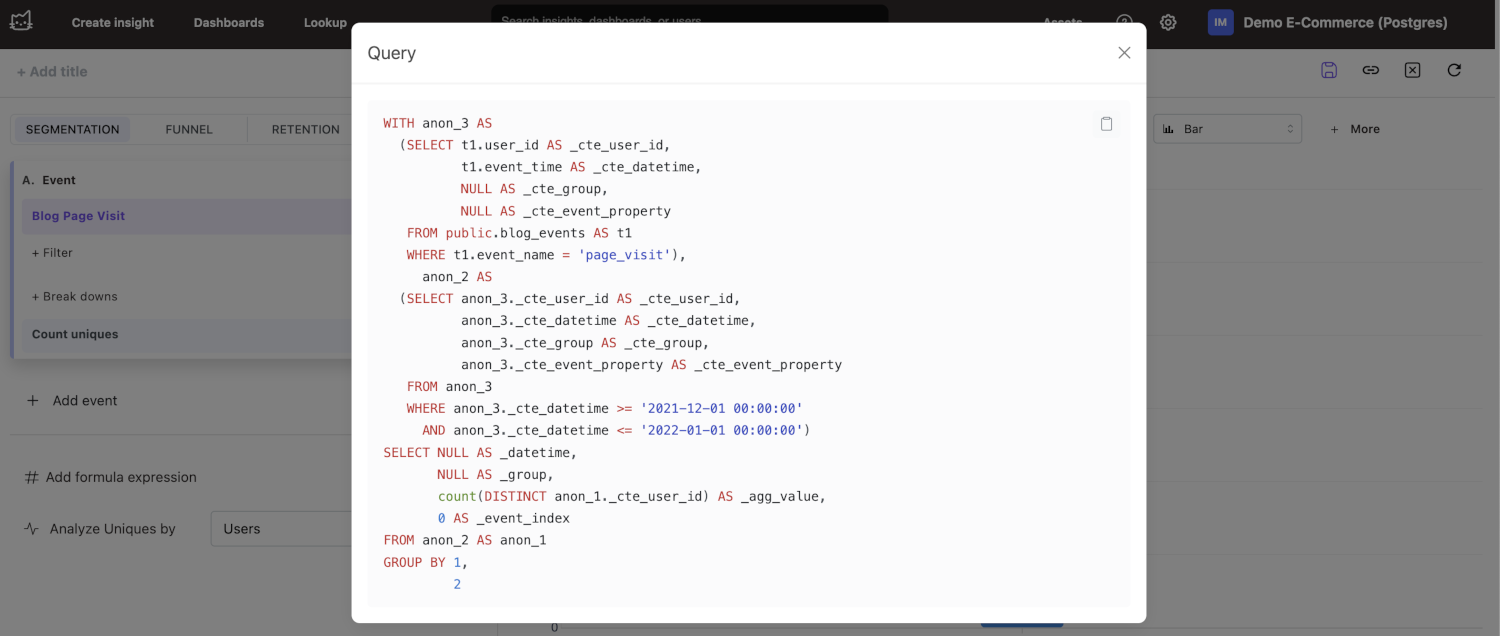
Show SQL
This shows the SQL query Mitzu generates for the insight.
Annotations
This option turns global annotations on or off for the insight.
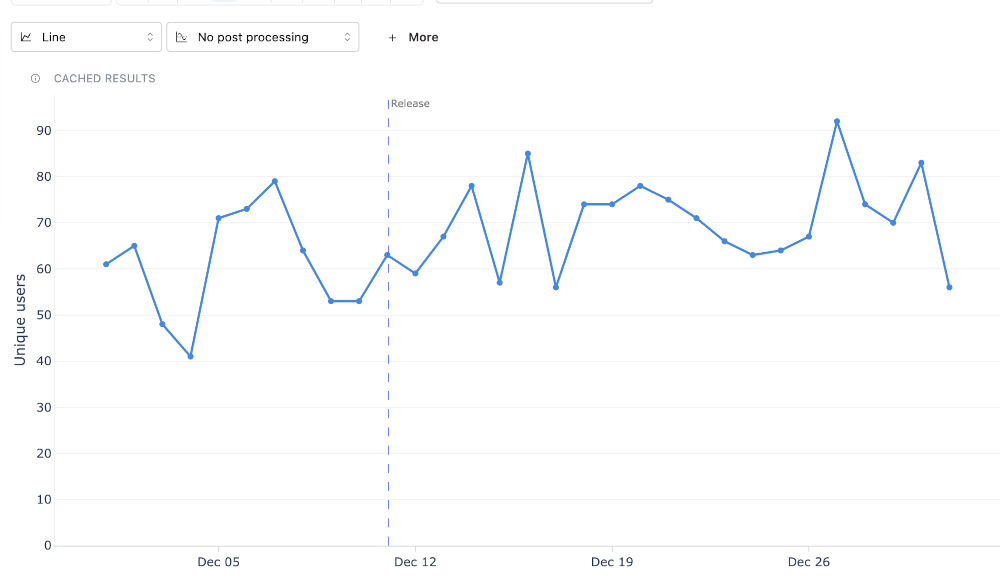
Forecast
When the insight is rendered as a trend, the Forecast toggle extends the chart with a projection of the next periods based on the historical pattern of the visible series. Forecasted values are drawn as a continuation of the existing series so you can see them in the same chart context.
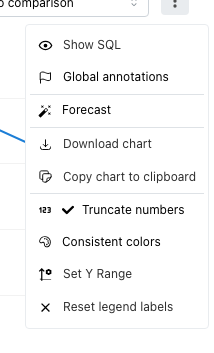
Forecast is only available when a trend granularity is selected. It is hidden for Overall measurements.
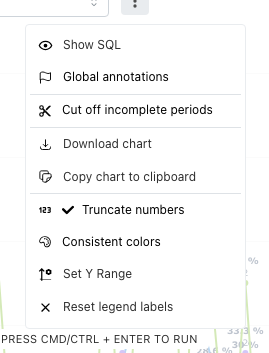
Cut off incomplete periods
For retention insights, the Cut off incomplete periods toggle hides cohort cells whose retention period has not yet fully elapsed. This avoids the misleading dip you would otherwise see for cohorts that simply haven't had enough time to retain.
Download chart
This button downloads the currently visible chart as a PNG image to your computer.
Copy chart to clipboard
This button copies the chart as a PNG image to your clipboard so you can easily paste it into other applications.
Truncate numbers
This button rounds and truncates numbers, making them easier to read.
Consistent colors
This button ensures that the same groups are shown with the same color. This is useful on dashboards that have multiple insights with the same breakdown.
Set Y Range
This button opens a modal where you can set the range of the chart's Y axis.
Reset labels & colors
This clears every legend label rename and color override in the current insight at once, returning all series to their original names and the colors Mitzu assigns automatically. To reset only one series, edit its legend chip instead (see Legend interactions).
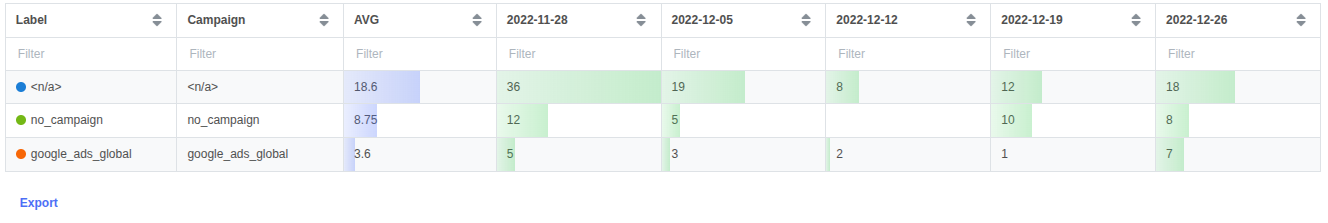
Table and CSV export
Below the chart, you can see the result as a data table. The table has different columns depending on your insight type and segments. Click the Export button to download the table contents in CSV format.