Annotations
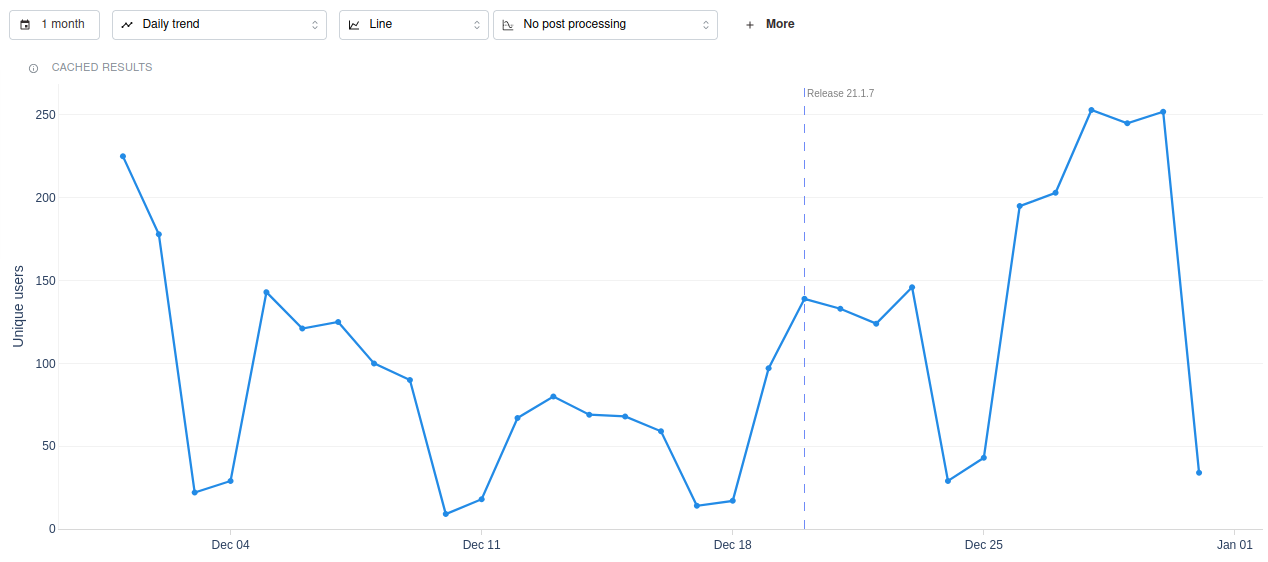
Use cases for global annotations
Example use cases:
- Marking product release cycles
- Highlighting critical events in your application's history
- Noting the launch of new marketing campaigns or strategies
- Naming a period you keep coming back to — a campaign window, a promotion, a fiscal quarter — so you can pick it as a date range instead of retyping the dates
Add global annotations
You have three options for adding global annotations:
- On the insights page
- On the application home page
- By asking the analytics agent
Adding global annotations from the insights page
You can add global annotations on any insight where the X-axis is time. This means you are visualizing a "trend" in the insight.
You can't add annotations from Journey or Overall Retention insights.
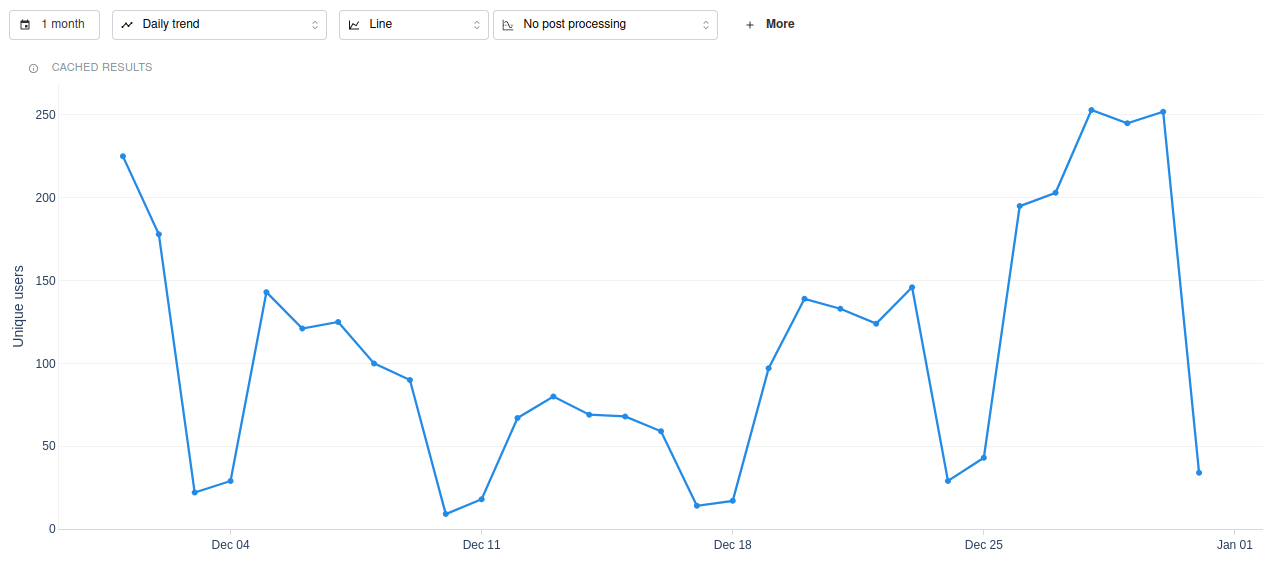
Once the trend chart loads, click any point and then click the "Add annotations" button. This opens a new menu where you must type in the name of the annotation.
Adding global annotations from the Home page
You can also add annotations on the home page by clicking the "+ More" button and then selecting "New annotation."

Adding global annotations with the analytics agent
The analytics agent can add an annotation from a plain request — for example "add an annotation for the v2.0 release on 15 March" or "mark the start of the spring campaign on the charts". The agent first proposes the title and the date and time (in GMT), and only saves the annotation once you confirm. If you name an event without saying when it happened, the agent asks for the date rather than guessing one.
The agent can also change an existing annotation: rename it, move it to another date, recolor it, or hide and unhide it. It looks the annotation up, shows you its current values next to the change it is about to make, and waits for your confirmation. Deleting an annotation is only possible from the annotation page.
Editing global annotations
All annotations are listed in the homepage assets list. Clicking an item in the list will redirect you to the edit page.
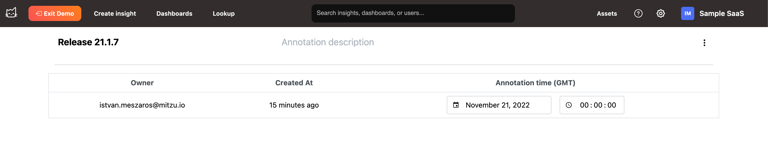
On the annotation edit page, you can modify the title, description, start time, end time, and color of the annotation. The selected color is used for the annotation's line and label on every chart and dashboard. New annotations default to dark gray.
Labelled date ranges
An annotation covers a period rather than a moment as soon as you give it an end date under End time on the edit page. Leave the end date empty and the annotation stays a single marker, exactly as before.
An annotation with an end date behaves differently in two ways:
- On charts it is drawn as a shaded band spanning the period, instead of a single dashed line. Hovering the band shows the title and description. Where two bands overlap, their labels are stacked so both stay readable, and a band that starts or ends outside the chart's window is drawn up to the edge of the window.
- In any date selector it can be chosen as the date range.
The start and end each have a date and an optional time. Leave the start time empty and the annotation starts at the beginning of that day. Leave the end time empty and the range includes the whole end day: a range covering 28 November to 1 December is simply 28 November to 1 December, with no times. Set an end time only when the range should stop at a specific moment, in which case it stops at exactly that time.
Using an annotation as a date range
Open the date selector on an insight or on a dashboard. Each of the two date controls has a flag button beside it, listing the annotations that control can express:
- The flag next to Custom date range lists annotations that have an end time, and scopes to that period.
- The flag next to Since date lists annotations that mark a single moment, and scopes to everything since then — useful for "how have things gone since the v2.4 release".
Each list has its own search. If what you are looking for is in the other list, the empty state says so and names the control to look under. A flag only appears when there is at least one annotation of that kind, so a workspace with no ranges yet sees only the one.
The date button then shows the annotation's name rather than the dates, so it stays obvious which period the numbers cover. On a dashboard the tile's subtitle names it too, since a tile has no date button of its own.
Because the insight keeps a reference to the annotation, correcting the annotation's dates later updates every insight and dashboard tile that uses it, the next time they load. If the annotation is deleted, or the insight is opened in a workspace that does not have it, the insight keeps working on the dates that were in effect when the range was picked — it shows those dates instead of the name.
Hiding an annotation takes its band off charts but keeps it in these lists, marked as hidden. The period is still a useful thing to scope to; the marker is there so you know why no band appears on the chart.
Labelled date ranges and the analytics agent
The agent can create one from a plain request — "mark the Black Friday campaign, 28 November to 1 December" — proposing both the start and the end for you to confirm.
It can also scope an insight to a range you already have: ask "how did signups do during Black Friday?" and it finds the annotation by name and builds the trend against that period. The saved insight keeps the reference, so it follows the annotation the same way one you built by hand would.
Hiding a single annotation
Tick the "Hidden" checkbox on the annotation edit page to take that annotation off every chart and dashboard without deleting it. The annotation stays in the assets list and keeps its name, description, date and color, so you can bring it back at any time by unticking the box.
Use this when an annotation is still worth keeping as a record but has become noise on your charts. To turn off all annotations for a single chart instead, use the "Global annotations" toggle described below. You can also ask the analytics agent to hide or show an annotation — "hide the Black Friday annotation" — and it applies the change after you confirm.
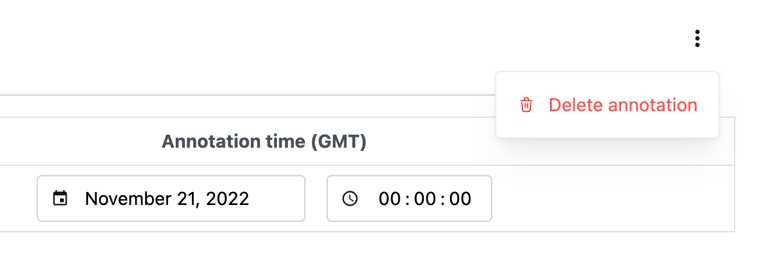
You can also delete the annotation from this page by clicking the actions menu and then selecting "Delete annotation."
Show/hide annotations on charts and dashboards
This toggle is available on both the Dashboards page and the Insights page.
Annotations in AI chats
Charts created by the AI agent do not show global annotations by default, so a chat answer stays about the numbers you asked for.
Ask for them and the agent turns them on for that chart — for example "show the annotations", "mark the releases on this trend", or "add the event markers". The agent does not carry the setting over to the next chart, so ask again whenever you want annotations on a follow-up insight.
As everywhere else, annotations only appear on time-series charts. Retention heatmaps, journey charts, pivot tables and single-number ("total") charts never show them, so asking for annotations on one of those has no visible effect.