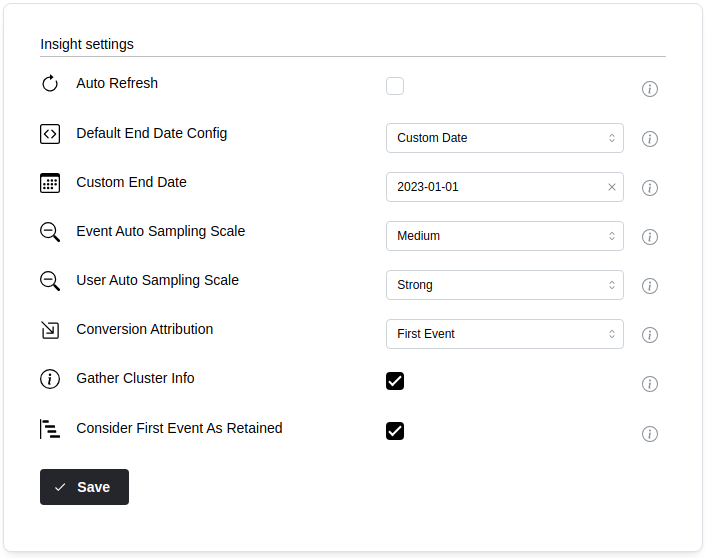
Insight settings
The Insight settings tab controls how new insights behave in this workspace — how dates are shown, how funnels and retention count events, and how Mitzu talks to your warehouse from the Insights page. Changes apply to every member of the workspace and are saved automatically.
Performance-related options (sampling, resolution, "first period" filter) now live on the Performance settings tab. AI options live on the AI settings tab.
Workspace display
Presentation defaults applied to every insight, chart, and dashboard.
- Default entity: The entity (for example User, Account, Session) that insights count by default. The Insights page uses this when an insight doesn't specify one. You can add or rename entities on the Entities tab.
Default date range
Controls the end date that every new insight starts with. The start date is always expressed relative to this end date (for example "last 30 days").
-
End date mode: How Mitzu picks the end date for new insights.
Mode Use it when Start of the current day Your pipeline lands yesterday's events once per day. Picks today at 00:00. End of the current day Events are loaded near real-time or in frequent batches. Picks today at 23:59:59. Now Events are loaded near real-time and some events may be stamped with future timestamps that you want filtered out. Custom date The dataset is frozen (for example a discontinued project). Use with Fixed custom end datebelow. -
Fixed custom end date: Pins every new insight to this exact date. Only enabled when End date mode is
Custom date.
Funnel & retention defaults
How Mitzu matches a user's events to each step of a funnel or retention chart.
-
Conversion attribution (funnels):
First: only the user's first matching event at each step counts. Fast, conservative, recommended for most use cases.Every: every matching event at every step counts. More permissive (and more expensive to compute).
-
Retention attribution (retention):
First: only the first retaining event per user in each period is counted.Every: every retaining event is counted.
-
Loose timestamp comparison (formerly "Allow same-timestamp conversions"): allow a 1 minute grace period when comparing the order of events, so a step can happen up to 1 minute before the previous step and the user is still counted as converted. Applies to funnels, retention, and journeys. This sets the workspace default; it can be overridden per chart from the conversion window menu.
warningIf the same event is used at every step of a funnel or retention chart, one event can satisfy every step at once, inflating conversion. Keep this off unless your steps use distinct events.
-
Cut off incomplete retention periods: exclude users whose retention window hasn't fully elapsed yet. For example, if you analyze 7-day retention and a user signed up two days ago, they're dropped so the chart isn't dragged down by partial periods. Enabled by default, and can be overridden per chart.
Filtering & chart defaults
Small behavioral defaults applied to every new chart.
-
Case insensitive filtering:
Chrome,chrome, andCHROMEmatch the same events. When this is off, filters are case-sensitive. -
Fill missing values with zero: shows a zero bar instead of an empty slot for categories that produced no events. Applies to segmentation charts only.
-
Any event (experimental): adds a synthetic "Any event" entry to your event catalog that matches every event in the workspace. Useful for cross-event funnels like "did anything after sign-up". Recommended only when you have a single event table — with many event tables, "Any event" expands to a large OR-query that can be slow.
Querying & monitoring
Controls how Mitzu runs queries against your warehouse from the Insights page.
-
Auto refresh insights: re-runs the query every time someone tweaks a chart (adds a filter, changes a breakdown, etc.). Convenient for exploration but can overload a busy warehouse — enable with care.
-
Gather cluster info: collects cluster status alongside each query to help troubleshoot slow queries and visualize progress. Only has an effect on Snowflake, Databricks, BigQuery, and Trino.
Changes are saved automatically.