Statistics
The Statistics page shows how the current workspace is being used — which events and dashboards are active, and who is creating content. Use it to spot unused events, prioritize cleanup, and understand adoption across your team.
Export dashboard events
The Export dashboard events button downloads a CSV listing every dashboard in the workspace along with the events each one references. This is useful for auditing which events your dashboards depend on before removing or renaming them.
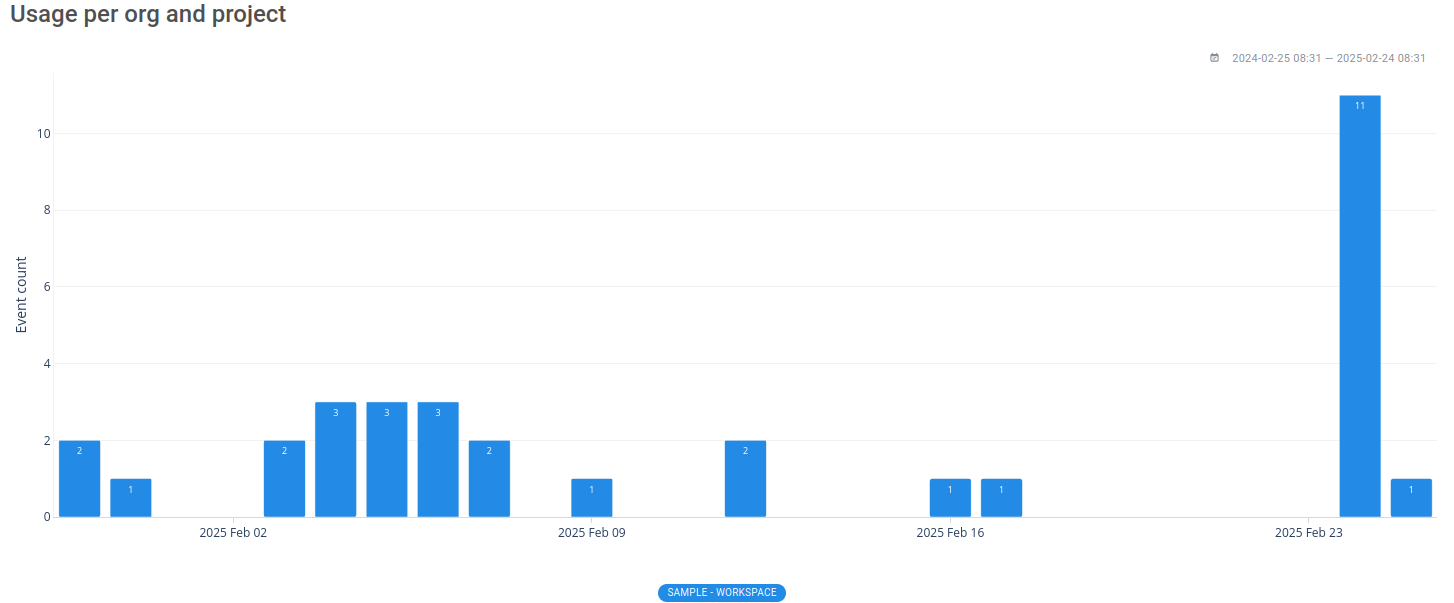
Export usage report
The Export usage report button downloads a CSV summarizing workspace activity — query volume, active members, and saved insight / dashboard counts — broken down over time. Use it to share adoption metrics with stakeholders or to audit how the workspace is being used.