Performance settings
The Performance settings tab speeds up funnels, retention, and journey insights on high-volume projects by reducing how many events and entities Mitzu processes — and by applying query-friendly defaults to new charts.
Use this tab when insights run slowly, your warehouse is under load, or you routinely hit query time limits. Changes apply workspace-wide and are saved automatically.
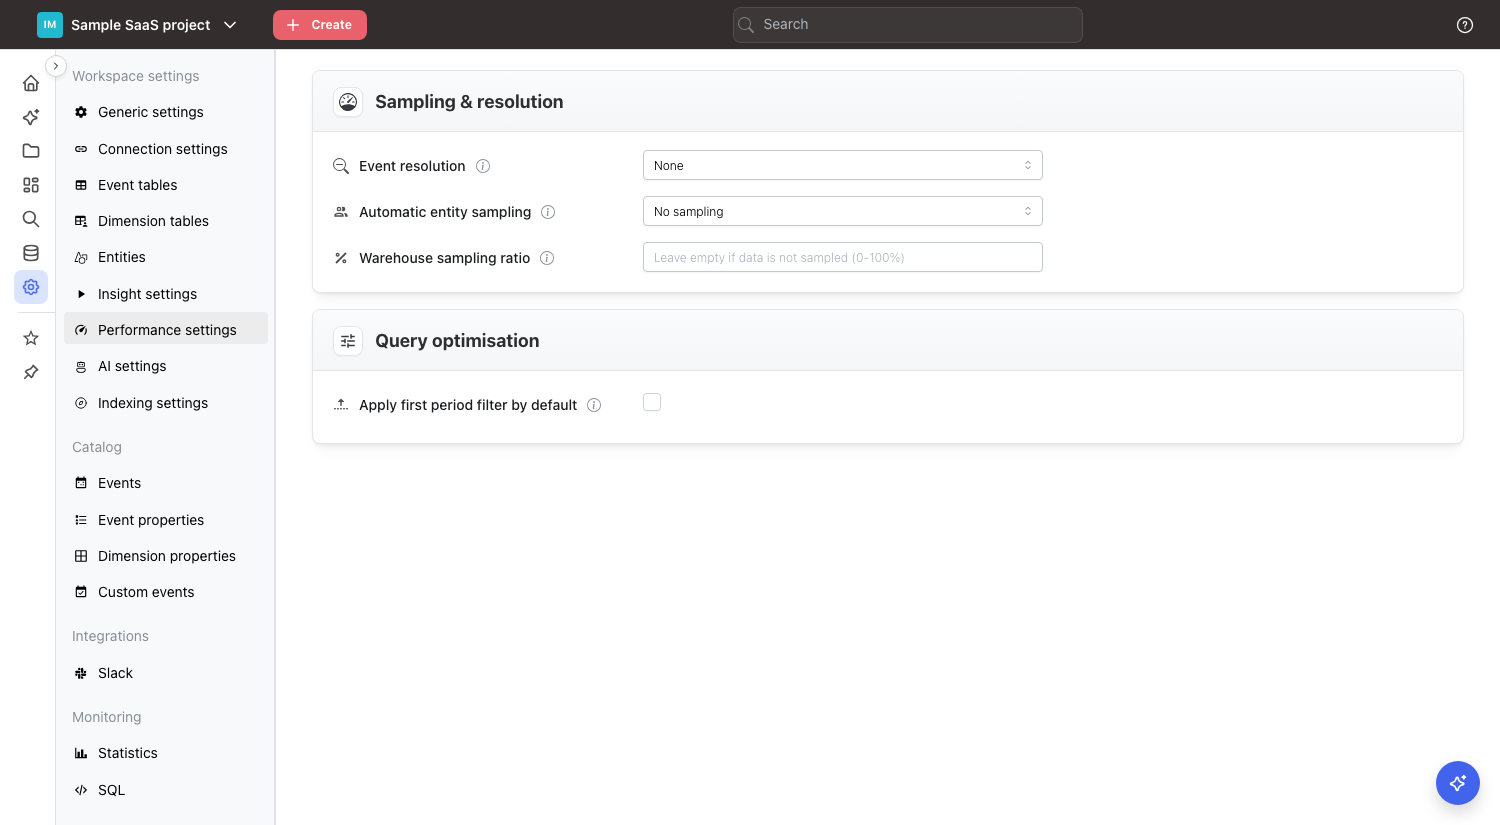
Sampling & resolution
Two knobs reduce event/user volume in very different ways. They are independent and can be combined.
| Setting | What it reduces | Effect on results |
|---|---|---|
| Event resolution | Collapses many events into one per user per time bucket (hour/day) | All users are still counted; event counts become "at least one" per bucket |
| Automatic entity sampling | Drops a random subset of entities (users, accounts, sessions...) | Fewer entities counted; results are statistically scaled back up |
Event resolution
Groups high-frequency events into a single event per user per hour or per day. Funnels and retention read far fewer rows, so they calculate faster. Every user is still in the result — you only lose sub-hour or sub-day granularity on the event stream.
When to use it:
- Users generate many events of the same type in a short time (think scroll, heartbeat, tick events).
- You don't need to distinguish "5 pageviews in a minute" from "1 pageview" in your funnel logic.
Choose hour for the lightest compression that still preserves intraday analysis. Choose day for maximum speed on daily funnels and retention.
Automatic entity sampling
Samples entities — users, sessions, accounts, or whatever your default entity is — across every funnel, journey, and retention insight in the workspace. The label reads as a volume reduction, e.g. "90% volume reduction" means Mitzu keeps roughly 10% of entities. Final aggregates are multiplied back up to approximate full-population numbers.
Trade-off: faster queries at the cost of precision. Small segments may become invisible if the sample rate is aggressive.
Recommended starting point on large warehouses:
- First, try 50% volume reduction and compare results with the non-sampled baseline.
- Only go higher if the speed-up justifies the precision loss.
Warehouse sampling ratio
Use this only when your warehouse already holds a pre-sampled subset of production events — for example, a pipeline that writes 1 of every 5 events for cost reasons. It tells Mitzu what percentage of source events actually reached the warehouse so final counts can be reconstructed.
- Enter a value between
0and100(percent). - Mitzu multiplies every count by
100 / valuein supported final aggregations. - Example: the warehouse holds 20% of events → set to
20→ Mitzu multiplies counts by5. - Leave empty when the data is not pre-sampled. Most workspaces should leave this empty.
Unlike Automatic entity sampling, this setting does not add sampling to the queries Mitzu generates. It compensates for sampling that already happened upstream.
Query optimization
Defaults that reduce warehouse load for new charts.
- Apply first period filter by default: turns on the "first period filter" for every new funnel and retention chart. The filter restricts the analysis to users whose first matching event falls inside the chosen date range, which is usually what you want and is dramatically cheaper to compute on high-frequency events. Strongly recommended for high-volume projects. Can be turned off per chart.
Changes are saved automatically.
Choosing the right lever
| Symptom | First thing to try |
|---|---|
| Funnels scanning millions of identical events per user | Event resolution: hour |
| Warehouse queue saturated, you need blanket speed-up | Automatic entity sampling: 50% |
| You already pre-sample upstream and counts look too low | Warehouse sampling ratio |
| New charts routinely time out or OOM | Apply first period filter by default |