Metrics
Some questions need more than one insight on the same chart: two funnels next to each other, or a funnel's conversion rate next to the number of users who entered it. Metrics are how you build those charts. A metric is a saved insight reused as a segment in a segmentation.
Instead of picking an event for a segment, you pick a saved insight from the Metrics section of the same dropdown, and the segmentation draws that insight.
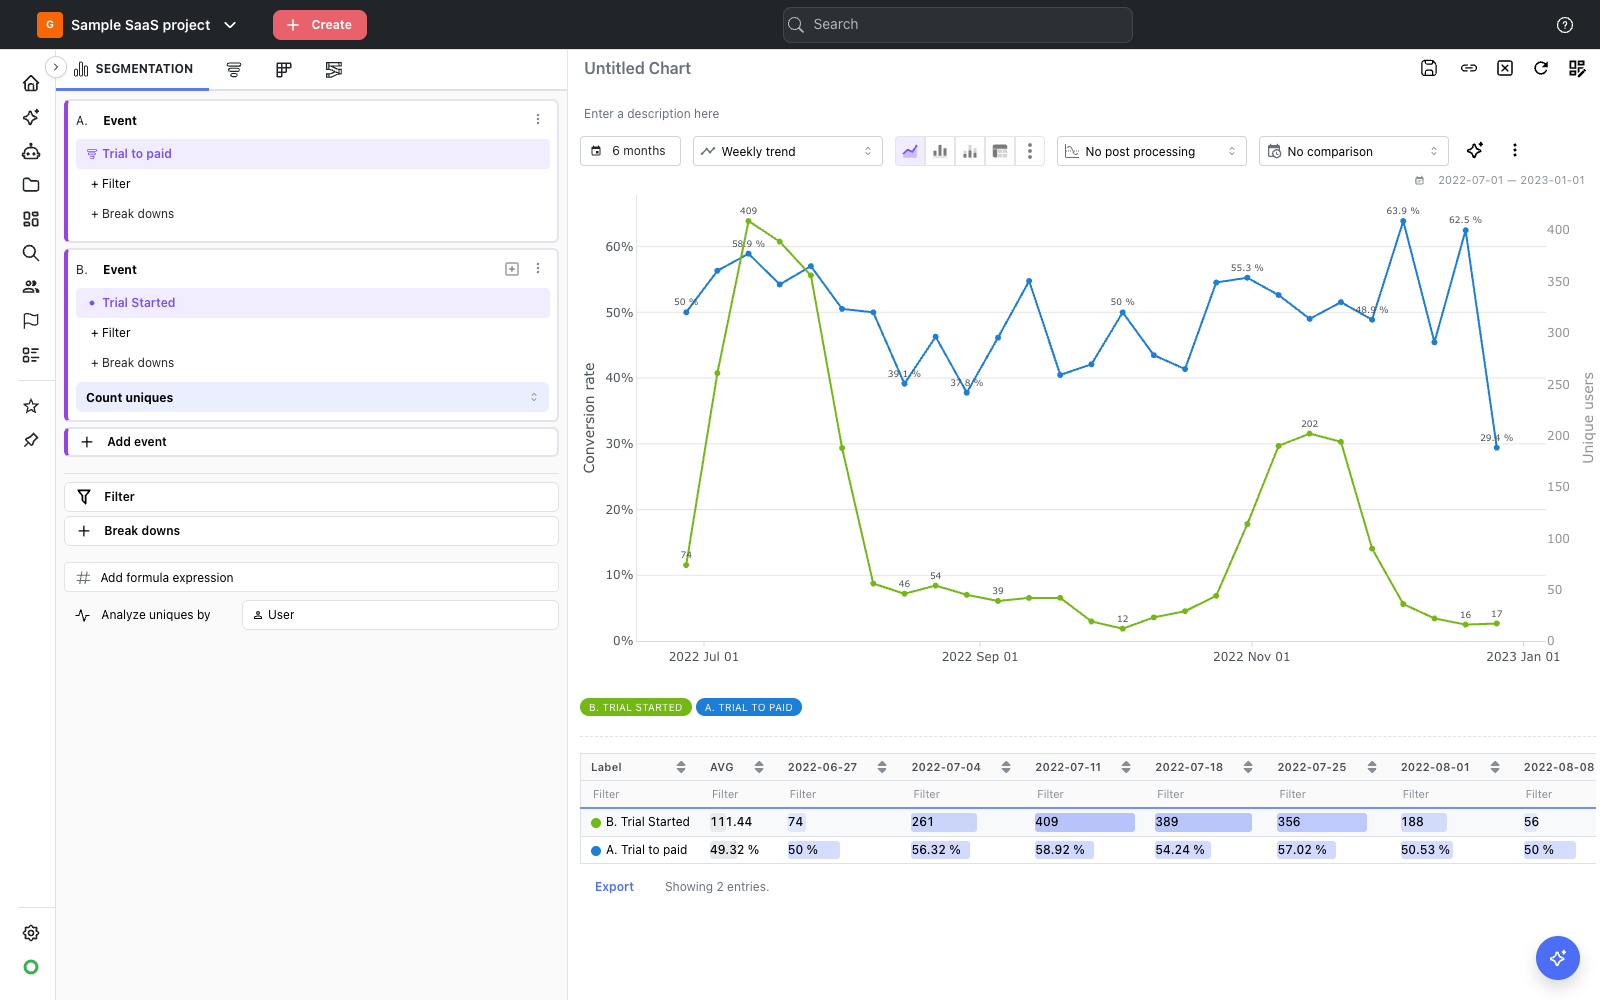
In the chart above, segment A is the saved Trial to paid funnel and segment B counts the
unique users who performed Trial Started.
Use cases
- Compare two or more funnels side by side, over the same periods and with the same break downs.
- Show a funnel's conversion rate next to the volume behind it, to tell a falling rate apart from a falling number of users.
- Break a saved funnel down by plan, country or campaign without rebuilding it.
- Keep every chart in the workspace on one shared definition of a funnel.
Which insights can be used as a metric
| Insight | Available as a metric |
|---|---|
| Funnel | Yes |
| Segmentation with one segment and no calculation | Yes |
| Segmentation with several segments, or with calculations | Yes — pick which number it shows |
| Retention, journey | No |
Two further cases are excluded:
- Insights measured as a user list (
Return unique users,Return drop-off users). They return users rather than a value, so there is nothing to plot. - Insights that already use a metric. Metrics cannot be nested.
The insight you are editing is listed too. If you add it as a metric and save, Mitzu saves the result as a new insight and leaves the original unchanged.
Adding a metric to a segmentation
- Create or open a segmentation insight.
- Open the event dropdown for a segment and go to the Metrics section.
- Select the saved insight. It replaces the event for that segment.
- Add further segments as usual — more metrics, ordinary events, or a mix of the two.
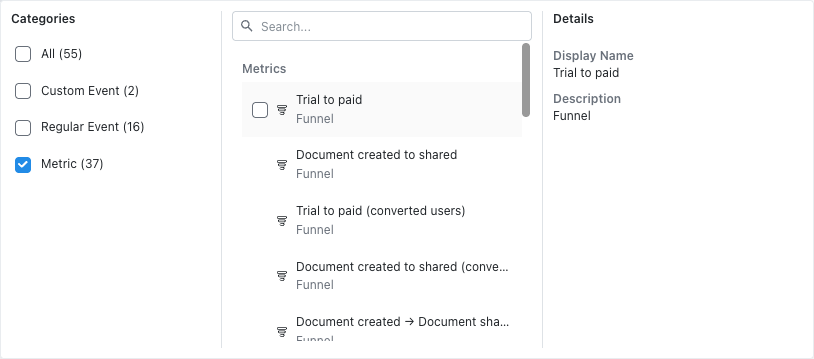
Choosing what the metric shows
A saved insight can hold more than one number: each of its segments, and each of its calculations.
A metric shows one of them, chosen in the Output row under the insight name.
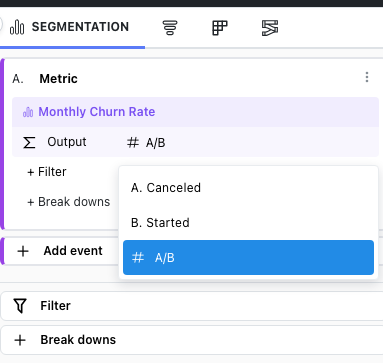
An insight with a calculation opens on that calculation, because its segments are what the
calculation is built from. An insight that holds a single number has no Output row.
To show two numbers from the same insight on one chart, add it as a metric twice and set a different output on each. Each keeps its own unit, so a rate and a count land on separate axes.
What the segmentation controls, and what the metric keeps
The segmentation sets the time frame and how the results are sliced. The saved insight sets what is measured.
| The segmentation controls | The saved insight keeps |
|---|---|
| Date range | Its events and their order |
Trend granularity, or Overall | The filters saved with it |
| Filters and break downs you add | Its measurement — conversion rate, count, or time to convert |
| Chart type, comparison, post-processing | A funnel's conversion window and attribution |
Uniques sampling, when it is set | Its own Uniques sampling, when the segmentation has none |
A funnel saved with a one-month window shows six months of weekly conversion rates in a six-month weekly segmentation. Its steps, conversion window and measurement do not change.
A metric is measured the way it was saved and cannot be re-measured from the segmentation, which is why a metric segment has no aggregation type dropdown. To get the number of converted users from a funnel saved as a conversion rate, save a second funnel with that measurement and use it as a separate metric.
Uniques sampling
Uniques sampling is the one setting the segmentation can take over from the saved insight. Set it
on the segmentation and every segment on the chart runs at that rate, so the numbers stay
comparable with each other. Leave it at No sampling and each metric runs at the rate it was saved
with, which is what a saved insight sampled at 10% does on an unsampled segmentation.
See Data sampling and resolution for what sampling does to the numbers.
Editing the saved insight
A metric always runs the saved insight's current definition, so changes reach every insight using it. A metric cannot be edited from the segmentation itself. To change one, open the saved insight: find it in the search bar at the top of the page, or on the Insights page under Assets, edit it there and save. See Saved Insights.
- Editing the saved insight — its events, filters or measurement — changes every insight that uses it as a metric, from the next run onwards. Earlier values are not kept.
- Renaming it, or changing its labels and colours, does not change any values.
- Removing the segment or calculation a metric shows breaks the insights drawing it: they name the number that is gone rather than switching to another one.
- Deleting it breaks the insights that use it: they report that the saved insight no longer exists, and the segment is shown as invalid. Mitzu does not block the deletion, so check which insights use it first.
Filters and break downs
A metric segment has the same + Filter and + Break downs rows as an event segment.
A filter applies to the whole saved insight and reaches every step of a funnel. Filtering a signup
funnel by User Country Code is us gives that funnel's conversion rate among US users, rather than
filtering its first step only.
Only properties present on every step are offered. A property carried by the checkout event but not by the add-to-cart event is not offered, because filtering by it would drop the earlier step and report the wrong conversion rate. Where a filter cannot be applied, Mitzu names the insight, the property and the event rather than ignoring the filter.
Break downs behave the same way. A break down set for the whole insight in the Break downs panel
also applies to metric segments.
Charts with more than one unit
Metrics bring their own unit: a conversion rate is a percentage, a user count is a plain number, and a time to convert is a duration. A percentage between 0 and 100 and a count in the thousands cannot share a scale.
Dual axes resolves this. On a trend, the second unit is drawn against its own axis on the right, with its own scale and title:
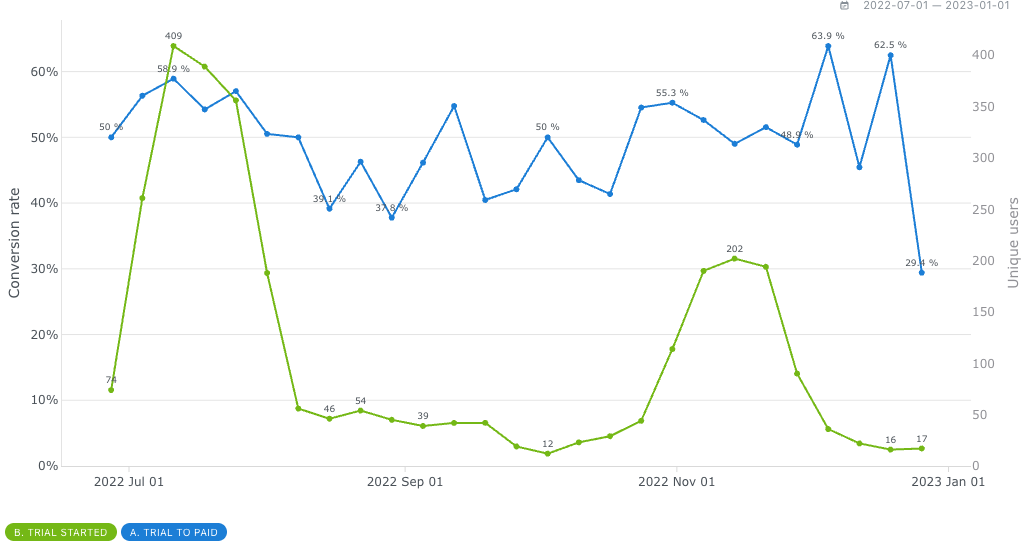
Here Conversion rate reads on the left axis and Unique users on the right. Dual axes is on by
default and applies to line, bar, stacked bar and stacked area charts.
- To put every segment back on one axis, turn
Dual axesoff in theMoremenu. - A third unit has no axis left. Mitzu reports this and suggests a pivot table, which can hold all of them.
- Segments hidden from the legend do not count towards the two.
Overallcharts and percentage comparison do not split axes; with percentage comparison every value is already a percentage.
Durations are shown in the unit that fits their values: seconds, minutes, hours or days. A funnel that converts within hours is shown in hours, one that takes weeks is shown in days.
Tables and pivot tables
Each value carries its own unit (58.9 %, 13.3 days, 409). Where the segments do not share a
measurement, the header reads Calculation instead of naming one of them.
In a pivot table, each column header states the measurement of the insight behind it.

On the chart, a metric segment is labelled with the name of the saved insight, followed by the
output it shows when the insight holds more than one. A column carrying a calculation says
Calculation where a column carrying a segment names its measurement. Renaming a segment in the
legend changes the label on that chart only.
Building a metric chart with the agent
Ask the Analytics Agent for the comparison and it builds the segmentation:
Compare the signup funnel and the trial funnel by country, as a pivot table, last 3 months.
The result is a single chart rather than two funnel insights and a written comparison. The same applies when a funnel has to appear next to something else, as in "the signup funnel conversion next to the number of trials started".
If a saved funnel matches the question, the agent uses it, so the chart runs the workspace's own definition. If none matches, it builds the funnel and saves it — a funnel has to be saved before it can be used as a metric — and names the insights it saved. Repeating the question reuses them rather than creating duplicates.