Analytics Agent
The analytics agent helps you understand your product data through natural language. Ask a question, and the agent will search your workspace, explore your data catalog, and create the right analysis for you.
Where to access the agent
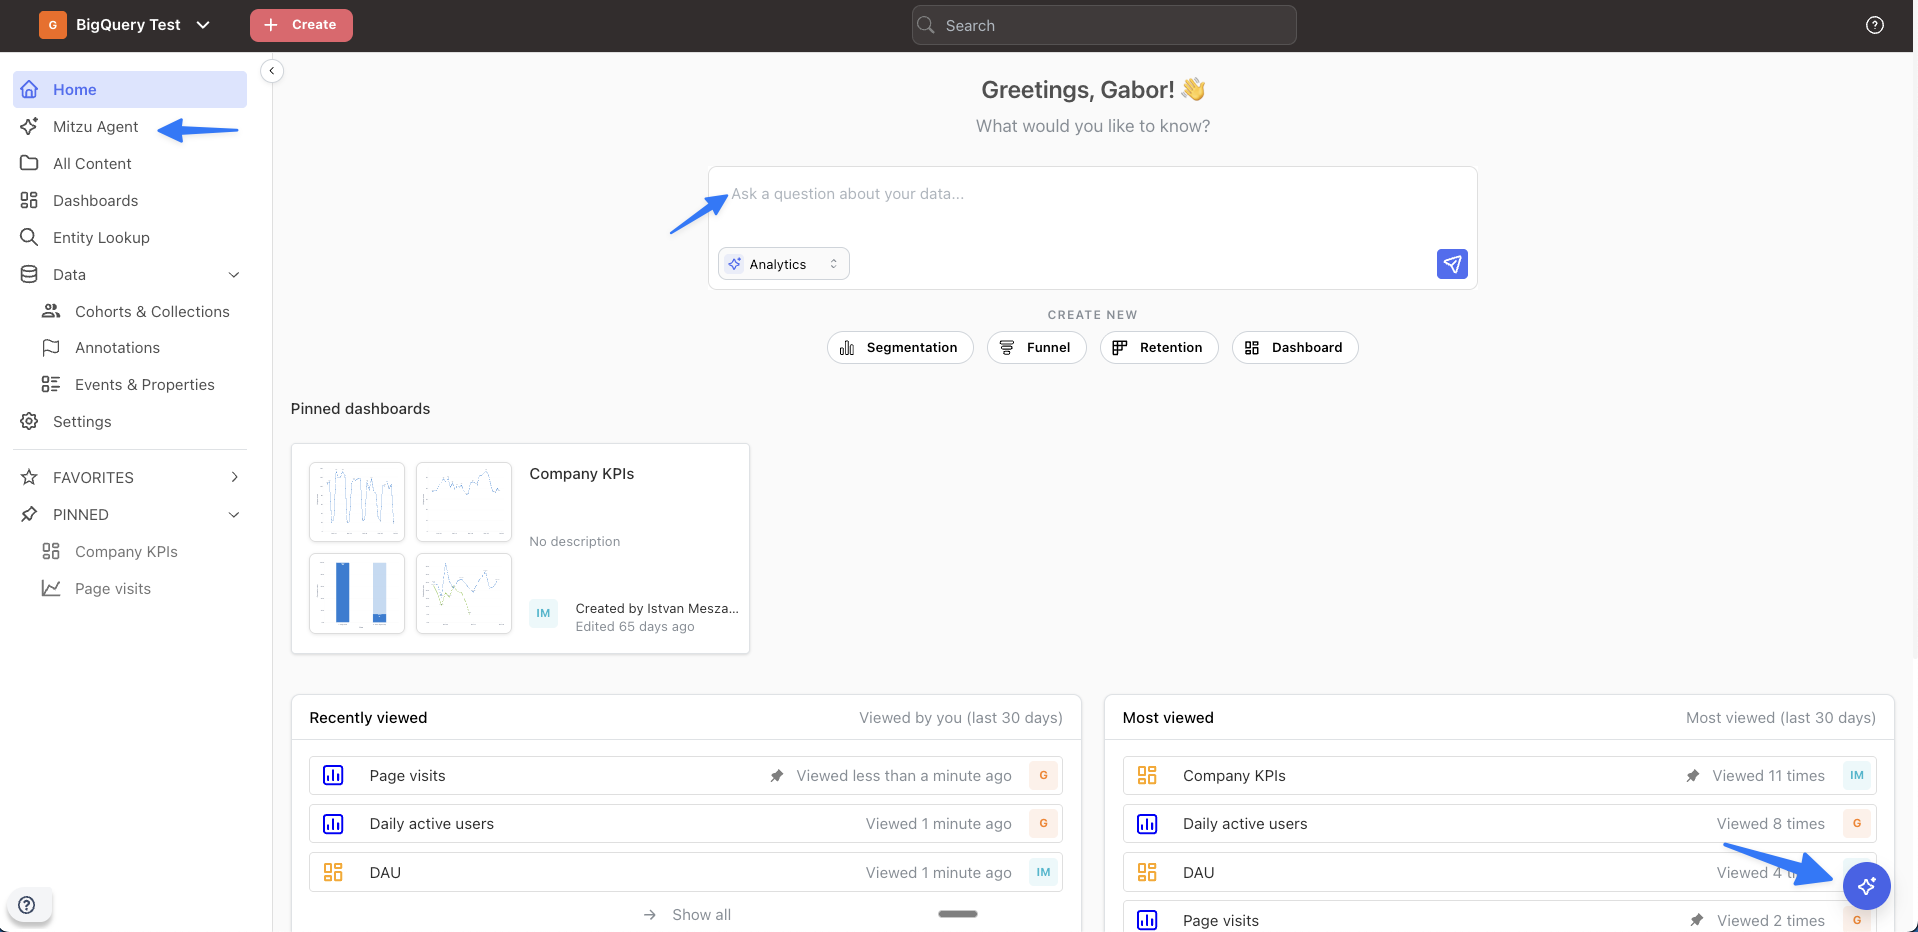
You can start a conversation with the agent from several places:
- Home page — type your question directly in the input area.
- Sidebar navigation — click Mitzu Agent in the left sidebar to start a new conversation in a full-screen interface.
- Floating button — the agent button in the bottom-right corner is available on every page. Click it to open the agent in sidebar mode without leaving your current view.
The floating button opens the agent in sidebar mode, letting you chat while keeping your current page visible. You can switch between sidebar and full-screen modes at any time using the Expand and Minimize buttons.
What you can ask
The agent supports several types of analysis. Here are examples for each.
Segmentation
Count events, unique users, trends over time, and breakdowns by properties.
- "How many users signed up this week?"
- "Show me daily active users over the last 3 months"
- "Compare signups by country"
- "What percentage of active users made a purchase?"
Funnels
Track conversion rates through sequential steps.
- "What's the conversion rate from signup to first purchase?"
- "Which campaigns drive the best conversion?"
- "How long does it take users to go from trial to paid?"
Retention
Measure whether users return after an initial action.
- "What's our day 1, day 7, day 30 retention?"
- "Show me retention by signup source"
- "Are users who signed up last month coming back?"
Discovery
Explore existing insights and your data catalog.
- "What insights do we have about engagement?"
- "What events do we track?"
- "Show me the top insights"
How the agent works
When you ask a question, the agent follows a structured workflow:
- Searches your workspace for existing saved insights that match your question. If a relevant insight exists, the agent runs it and shows you fresh results rather than creating a duplicate.
- Explores your data catalog if no existing insight matches. The agent discovers the right events, properties, and dimension tables to answer your question.
- Creates an analysis — a segmentation, funnel, or retention insight — and runs it to generate a chart and key findings.
- Presents the results with a summary highlighting the most important numbers, alongside a chart visualization. Occasionally the agent will also embed a custom chart when a derived view — a ratio, a joined top-N, or an overlay — would make the answer easier to read.
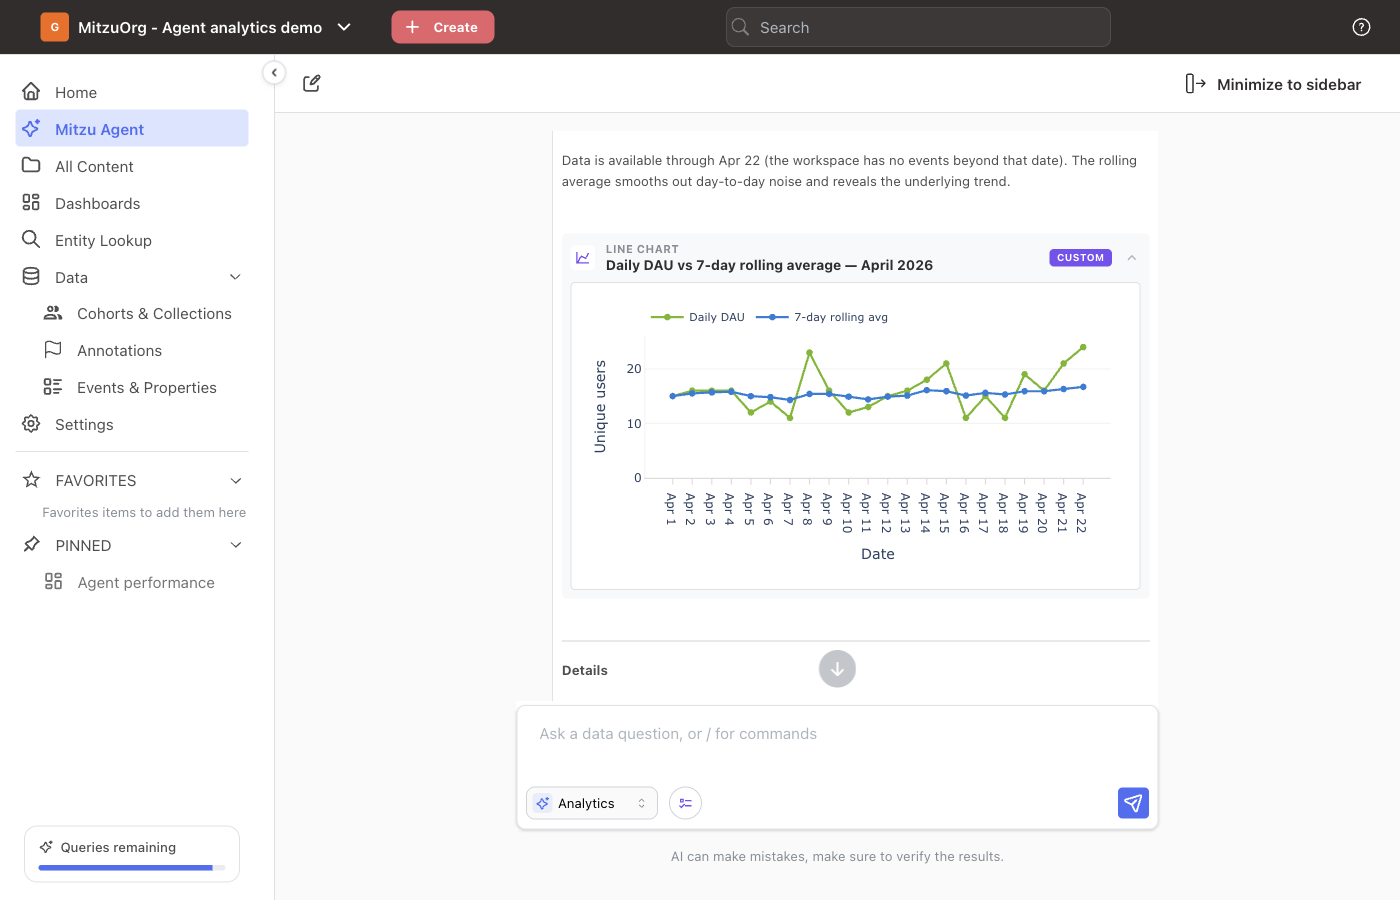
Custom charts
Custom charts let the agent go a step beyond running individual Mitzu insights. It can combine the results of multiple insights and run its own calculations on top of them — a ratio between two metrics, a period-over-period diff, a trend overlay — to answer questions that no single saved insight can answer on its own. The agent then presents the derived result as a custom chart: a collapsible card with a violet Custom badge, embedded directly inside its summary so the calculation is easy to digest in context.
When the agent draws one
- Derived ratios — e.g., "Show me DAU/MAU ratio over the last 90 days." The ratio isn't a saved insight, so the agent computes it from DAU and MAU and plots just the ratio as a line.
- Period-over-period comparisons — e.g., "Show me signups by plan tier in Q3 vs Q4 with the % change." The agent runs both periods, computes the growth, and renders a small comparison table with the diff column already filled in.
- Funnel trends on one chart — e.g., "Plot the signup → activation conversion rate week over week alongside the trial → paid conversion rate." A single funnel has multiple steps and can't share one chart with another, but the overall conversion rate of each funnel is one number per week, so the agent renders both as lines on the same chart and you can see the trends moving together (or apart).
Working with a custom chart
Custom charts are presentation only — they expand and collapse, but cannot be saved as insights, added to dashboards, or opened in the explore view, and only one appears per agent message. The Mitzu insights the calculation is built on are already shown above the summary — those are the savable artifacts, and you can save them or add them to a dashboard from there.
Working with results
When the agent creates an insight, you can:
- Click the insight link to open it in the full explore interface
- Edit the metric — change filters, time windows, breakdowns, or aggregation types
- Save it as a workspace insight for future use
- Add it to a dashboard to track alongside other metrics
The agent can also create and update cohorts directly from a request — for example, "save the users who dropped off at checkout as a cohort."
Conversations
The agent supports multi-turn conversations. You can ask follow-up questions in the same thread, and the agent will maintain context from previous messages.
- Start a new conversation anytime using the "New conversation" button in the header
- Switch views between full-screen and minimized sidebar mode
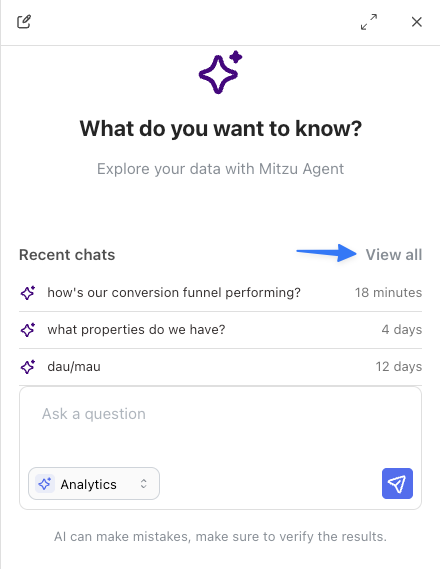
- Find past conversations — recent chats are shown in the sidebar agent panel. Click View all to see your full conversation history on the All Content page.
AI settings
Configure the agent's behavior in Settings → Insight Settings → AI Settings.
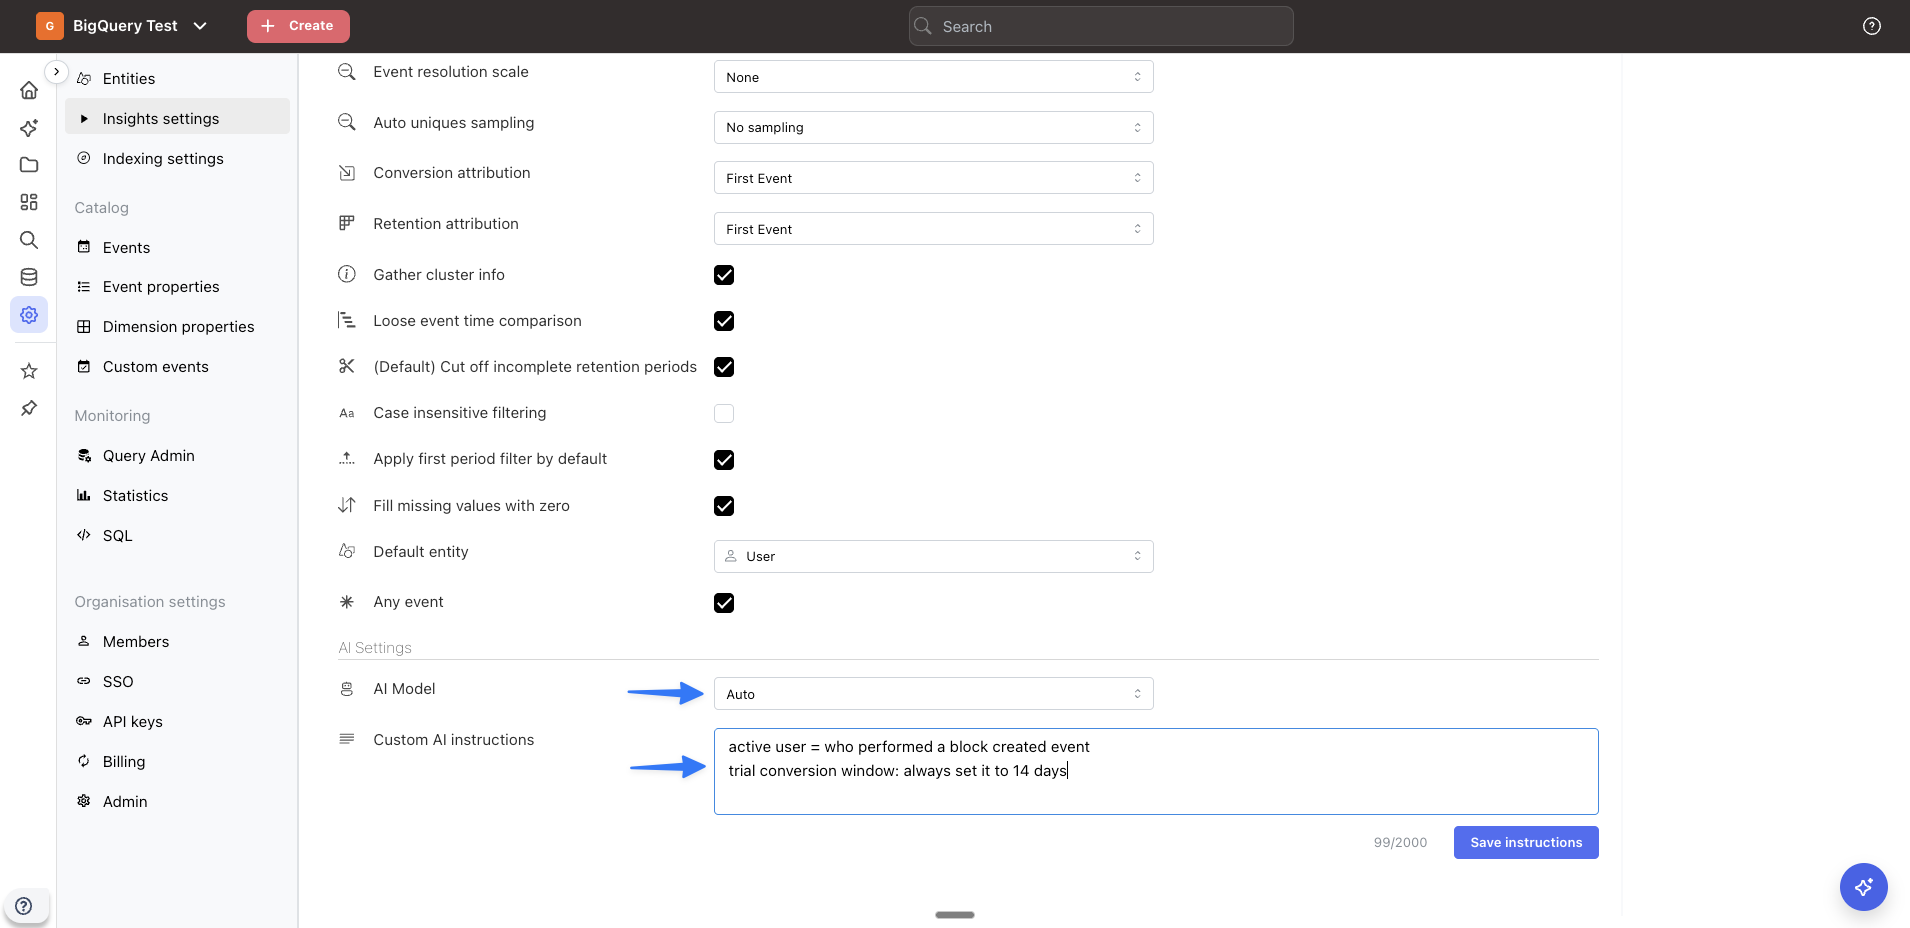
Model selection
Choose which AI model powers the agent:
- Auto (recommended) — intelligently selects a model based on query complexity
- Claude Sonnet — best for complex analyses that require deeper reasoning
- Claude Haiku — faster responses for straightforward questions
Custom instructions
Add workspace-specific context that the agent uses for every query. This is useful for:
- Domain-specific terminology (e.g., "a 'conversion' means a completed purchase")
- Default conventions (e.g., "always use weekly time groups" or "our conversion window is 7 days")
- Business context (e.g., "our fiscal year starts in April")
Custom instructions apply to all agent queries in the workspace. Keep them concise and focused on context that would help the agent give better answers for your specific product and data.
Web search
Off by default. When enabled, the agent can look up information on the public internet to enrich its answers. Two situations where this is most useful:
- Correlating your data with real-world events — e.g., "did our signups dip the week of the AWS us-east-1 outage?" or "compare our traffic on Black Friday to last year". The agent can pull in the external context (dates, news, public benchmarks) and combine it with the numbers from your workspace.
- Updating your workspace config from your own website — e.g., "look at our pricing page and add the plan tiers as a dimension" or "fetch our public docs and use them to rename these events". The agent can read your public-facing pages and use them to inform catalog changes.
Enable it from Settings → AI Settings → Web search. See AI settings for details.
Getting better results
The agent discovers events, properties, and dimensions from your configured data catalog. The quality of its answers depends directly on how well-organized your analytics data is — better naming, organization, and completeness mean better insights.
Here are actionable ways to improve the agent's output:
- Use descriptive display names — if your raw column names are cryptic (e.g.,
evt_pg_vw), add clear display names (e.g., "Page View") so the agent can find the right events - Create custom events for key business actions — this gives the agent clean, meaningful concepts to work with instead of raw event table names
- Configure dimension tables for user attributes you frequently analyze — the agent uses these for breakdowns like "by country" or "by plan"
- Add property descriptions — descriptions help the agent understand what a property means and when to use it for filters and breakdowns
- Keep your catalog up to date — re-index after adding new tables or columns so the agent has access to your latest data
- Use custom instructions (see above) to give the agent domain context it can't infer from the data alone
- Use planning mode for broad or multi-step questions — the agent proposes a plan you can review and refine before any work runs, so you steer the investigation rather than redirect a finished one