Warehouse Metric Catalog
The warehouse metric catalog lists every metric your metric tables provide, so you can give each one a clear name and description and choose which ones the Insights page offers.
Warehouse metrics are added and removed automatically when an admin adds, changes or removes a metric table. You cannot create or remove them in the catalog.
Use cases
Maintaining the display name and description of each warehouse metric can help you:
- name a metric the way your team talks about it, for example
MRRinstead ofmrr_eod - explain how a metric is calculated, such as which revenue counts as booked, so everyone reads the chart the same way
- hide a metric that is still being built, or that only the data team should use
All features
Browsing warehouse metrics
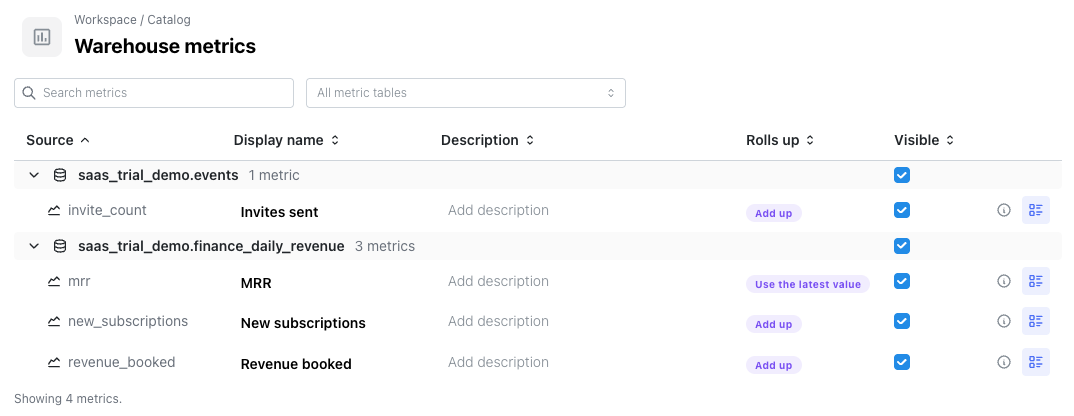
Catalog → Warehouse metrics lists every metric of the workspace, grouped under the metric table it comes from. Click a table row to collapse or expand its metrics.
Each metric table row shows:
- the table name in
<schema>.<table name>format - how many metrics the table has
- a checkbox that shows or hides every metric of the table at once. It appears half-selected when only some of the metrics are visible.
Each metric row shows:
- Source: the column of the metric table the metric reads.
- Display name: the name of the metric on the Insights page, in charts, dashboards and the analytics agent's answers.
- Description: explains the metric to anyone browsing the catalog. The analytics agent reads it too, to pick the right metric for a question.
- Rolls up: the rule that decides what longer periods show, for example Add up or Use the latest value. An admin sets it on the metric table; see Rolling up to longer periods.
- Visible: whether the Insights page offers the metric.
- an info icon showing when the metric table was last indexed
- a list icon that opens the metric's break downs, described below
Use the search box to filter metrics by display name, description, column name or metric table, and the table dropdown to jump to one metric table. Click any column header to sort by it, and click it again to reverse the order.
Updating display name, description
Click the display name or description of a metric and type. The catalog is updated when you leave the field or press Enter, and Escape discards what you typed. A display name can't be empty. Two metrics may share a name, but a distinct name is easier to pick in charts.
Saving the metric table on the Metric tables page keeps the names and descriptions you set here.
Hiding metrics
Clear the Visible checkbox to stop offering a metric on the Insights page. Saved insights and dashboard cards that already use it keep working. The analytics agent leaves hidden metrics out of what it lists, still charts one when you name it, and says in its answer that the metric is hidden in this workspace.
When every metric of the workspace is hidden, the Insights page doesn't show the Warehouse metric category at all.
Reviewing break downs
Click the list icon on a metric row to see what the metric can be filtered and broken down by:
- every dimension column of its metric table, with the property it is linked to and the values indexing found
- for each identifier column, the dimension tables it joins and their properties, for example
Through Company · crm.companies
When the list is empty, the metric table has no dimension or identifier columns; an admin can mark some on the Metric tables page.
Who can edit
Workspace members and admins can rename, describe and hide warehouse metrics. Viewers and visitors of a public workspace see the catalog read-only. Adding metric tables and changing their columns and roll-up rules is done by admins on the Metric tables page.